r6id.4xlarge by Amazon Web Services
Geekbench is a cross-platform processor benchmark with a scoring system that determines single-core and multi-core performance using loads simulating real-world scenarios. Geekbench 5 score is calculated with a reference score of 2500 representing the performance of the Intel Core i5-2520M @ 2.50 GHz. The software benchmark is available for Mac OS, Windows, Linux, Android and iOS platforms.
Specifications:
CPU
16
RAM
128.0 GB
Extra
1x
950 GB
SSD
Net
12000 Mbps
{
"configuration": {
"chart": {
"type": "scatter",
"polar": false,
"zoomType": "",
"options3d": {},
"height": null,
"width": null,
"margin": null,
"inverted": false,
"zooming": {}
},
"credits": {
"enabled": false
},
"title": {
"text": ""
},
"colorAxis": null,
"subtitle": {
"text": ""
},
"xAxis": {
"title": {
"text": [
"Single Score"
],
"useHTML": false,
"style": {
"color": "#666666"
}
},
"categories": null,
"lineWidth": 1,
"tickInterval": null,
"tickWidth": 1,
"tickLength": 10,
"tickPixelInterval": 100,
"plotLines": null,
"labels": {
"enabled": true,
"format": null,
"formatter": "",
"style": {
"color": "#666666",
"cursor": "default",
"fontSize": "11px"
},
"useHTML": false,
"step": 0
},
"plotBands": null,
"visible": true,
"floor": null,
"ceiling": null,
"type": "linear",
"min": 0,
"gridLineWidth": 1,
"gridLineColor": "#e6e6e6",
"minorTickInterval": null,
"minorTickWidth": 0,
"minTickInterval": null,
"startOnTick": true,
"endOnTick": true,
"tickmarkPlacement": 100,
"units": 100,
"minRange": 100
},
"yAxis": {
"title": {
"text": [
"Multi Score"
],
"useHTML": false,
"style": {
"color": "#666666"
}
},
"categories": null,
"plotLines": null,
"plotBands": null,
"lineWidth": null,
"tickInterval": null,
"tickLength": 10,
"floor": null,
"ceiling": null,
"gridLineInterpolation": null,
"gridLineWidth": 1,
"gridLineColor": "#e6e6e6",
"min": 0,
"max": null,
"minorTickInterval": null,
"minorTickWidth": 0,
"minTickInterval": null,
"startOnTick": true,
"endOnTick": true,
"minRange": null,
"type": "linear",
"tickmarkPlacement": null,
"labels": {
"enabled": true,
"formatter": null,
"style": {
"color": "#666666",
"cursor": "default",
"fontSize": "11px"
},
"useHTML": false
}
},
"zAxis": {
"title": {
"text": "Multi Score"
}
},
"plotOptions": {
"series": {
"dataLabels": {
"enabled": false,
"format": null,
"distance": 30,
"align": "center",
"inside": null,
"allowOverlap": false,
"style": {
"fontSize": "11px"
}
},
"showInLegend": null,
"turboThreshold": 0,
"stacking": "",
"groupPadding": 0.2,
"centerInCategory": false,
"findNearestPointBy": "x"
}
},
"navigator": {
"enabled": false
},
"scrollbar": {
"enabled": false
},
"rangeSelector": {
"enabled": false,
"inputEnabled": false
},
"legend": {
"enabled": null,
"maxHeight": null,
"align": "center",
"verticalAlign": "bottom",
"layout": "horizontal",
"width": null,
"margin": 12,
"reversed": false
},
"series": [
{
"name": "r6id.4xlarge by Amazon Web Services",
"color": "#f7981d",
"data": [
{
"x": 1239.5160211713796,
"y": 10088.144804982037
},
{
"x": 1233.401763016679,
"y": 10064.037024982075
},
{
"x": 1246.2569971360765,
"y": 10097.51424455944
},
{
"x": 1240.1566198927026,
"y": 10110.144315627767
},
{
"x": 1243.6869826910176,
"y": 10094.942307003406
},
{
"x": 1233.5534216017536,
"y": 10079.03395853245
},
{
"x": 1242.6224287556133,
"y": 10107.188061359386
},
{
"x": 1240.2170039118782,
"y": 10077.575168339532
},
{
"x": 1249.4516398243131,
"y": 10100.440762644783
},
{
"x": 1227.885847919527,
"y": 10011.551886238842
},
{
"x": 1249.3801201428264,
"y": 10127.71361247146
},
{
"x": 1235.4116009520326,
"y": 10105.272718115815
},
{
"x": 1237.1667937189509,
"y": 10139.240780859129
},
{
"x": 1244.6493673436103,
"y": 10158.01580762766
},
{
"x": 1249.3340178135002,
"y": 10087.508936955866
},
{
"x": 1250.7897905853577,
"y": 10146.428907072706
},
{
"x": 1257.575004275071,
"y": 10154.859279490607
},
{
"x": 1209.9819671670741,
"y": 10063.739703561288
},
{
"x": 1248.6125511259372,
"y": 10146.858098316485
},
{
"x": 1256.4406882971864,
"y": 10096.925998140161
}
]
}
],
"drilldown": {},
"tooltip": {
"enabled": true,
"useHTML": false,
"format": null,
"headerFormat": "",
"pointFormat": "<span style=\"color:{series.color}\">Single</span>: <b>{point.x:.0f}</b><br><span style=\"color:{series.color}\">Multi</span>: <b>{point.y:.0f}</b>",
"footerFormat": "",
"shared": false,
"outside": false,
"valueDecimals": null,
"split": false
},
"annotations": null
},
"hc_type": "chart",
"id": "166223005799824068288850729494325454668"
}
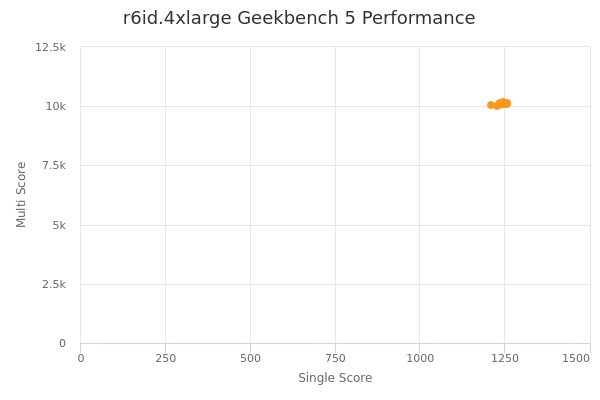
| Single | Multi | |
|---|---|---|
| Max | 1258 | 10158 |
| Average | 1242 | 10103 |
| Deviation | 10.52 | 35.19 |
| Min | 1210 | 10012 |
Sign up as Freemium to get more insight.