r6id.large by Amazon Web Services
Geekbench is a cross-platform processor benchmark with a scoring system that determines single-core and multi-core performance using loads simulating real-world scenarios. Geekbench 5 score is calculated with a reference score of 2500 representing the performance of the Intel Core i5-2520M @ 2.50 GHz. The software benchmark is available for Mac OS, Windows, Linux, Android and iOS platforms.
Specifications:
CPU
2
RAM
16.0 GB
Extra
1x
118 GB
SSD
Net
12000 Mbps
{
"configuration": {
"chart": {
"type": "scatter",
"polar": false,
"zoomType": "",
"options3d": {},
"height": null,
"width": null,
"margin": null,
"inverted": false,
"zooming": {}
},
"credits": {
"enabled": false
},
"title": {
"text": ""
},
"colorAxis": null,
"subtitle": {
"text": ""
},
"xAxis": {
"title": {
"text": [
"Single Score"
],
"useHTML": false,
"style": {
"color": "#666666"
}
},
"categories": null,
"lineWidth": 1,
"tickInterval": null,
"tickWidth": 1,
"tickLength": 10,
"tickPixelInterval": 100,
"plotLines": null,
"labels": {
"enabled": true,
"format": null,
"formatter": "",
"style": {
"color": "#666666",
"cursor": "default",
"fontSize": "11px"
},
"useHTML": false,
"step": 0
},
"plotBands": null,
"visible": true,
"floor": null,
"ceiling": null,
"type": "linear",
"min": 0,
"gridLineWidth": 1,
"gridLineColor": "#e6e6e6",
"minorTickInterval": null,
"minorTickWidth": 0,
"minTickInterval": null,
"startOnTick": true,
"endOnTick": true,
"tickmarkPlacement": 100,
"units": 100,
"minRange": 100
},
"yAxis": {
"title": {
"text": [
"Multi Score"
],
"useHTML": false,
"style": {
"color": "#666666"
}
},
"categories": null,
"plotLines": null,
"plotBands": null,
"lineWidth": null,
"tickInterval": null,
"tickLength": 10,
"floor": null,
"ceiling": null,
"gridLineInterpolation": null,
"gridLineWidth": 1,
"gridLineColor": "#e6e6e6",
"min": 0,
"max": null,
"minorTickInterval": null,
"minorTickWidth": 0,
"minTickInterval": null,
"startOnTick": true,
"endOnTick": true,
"minRange": null,
"type": "linear",
"tickmarkPlacement": null,
"labels": {
"enabled": true,
"formatter": null,
"style": {
"color": "#666666",
"cursor": "default",
"fontSize": "11px"
},
"useHTML": false
}
},
"zAxis": {
"title": {
"text": "Multi Score"
}
},
"plotOptions": {
"series": {
"dataLabels": {
"enabled": false,
"format": null,
"distance": 30,
"align": "center",
"inside": null,
"allowOverlap": false,
"style": {
"fontSize": "11px"
}
},
"showInLegend": null,
"turboThreshold": 0,
"stacking": "",
"groupPadding": 0.2,
"centerInCategory": false,
"findNearestPointBy": "x"
}
},
"navigator": {
"enabled": false
},
"scrollbar": {
"enabled": false
},
"rangeSelector": {
"enabled": false,
"inputEnabled": false
},
"legend": {
"enabled": null,
"maxHeight": null,
"align": "center",
"verticalAlign": "bottom",
"layout": "horizontal",
"width": null,
"margin": 12,
"reversed": false
},
"series": [
{
"name": "r6id.large by Amazon Web Services",
"color": "#f7981d",
"data": [
{
"x": 1228.3675815708339,
"y": 1425.0626471631117
},
{
"x": 1163.993115942671,
"y": 1380.7485094348053
},
{
"x": 1125.9652414191673,
"y": 1316.6116958878697
},
{
"x": 1043.395320355886,
"y": 1315.4050697791815
},
{
"x": 1202.2667988853586,
"y": 1416.7209302302629
},
{
"x": 1185.9059590688385,
"y": 1409.6236229024203
},
{
"x": 1125.591624286741,
"y": 1313.777588538312
},
{
"x": 1085.468461726232,
"y": 1321.0844634131347
},
{
"x": 1213.9158229078253,
"y": 1413.5104903285614
},
{
"x": 1168.8610506749626,
"y": 1402.6963746585218
},
{
"x": 1118.9389350330293,
"y": 1279.5321445200352
},
{
"x": 1097.6812716761979,
"y": 1315.3866697933188
},
{
"x": 1203.8500157777037,
"y": 1416.1139272999128
},
{
"x": 1131.842541129799,
"y": 1372.4699979971954
},
{
"x": 1045.2081662976798,
"y": 1307.9714512689468
},
{
"x": 1096.0132098395125,
"y": 1333.1488105775102
},
{
"x": 1213.8577974744912,
"y": 1415.9027076318616
},
{
"x": 1219.9268755770638,
"y": 1412.549132245123
},
{
"x": 1221.5112462039874,
"y": 1413.3176138975728
},
{
"x": 1113.6212693467603,
"y": 1340.919026117839
},
{
"x": 1222.8935994778435,
"y": 1398.629066693902
},
{
"x": 1152.1747646110266,
"y": 1410.5858075430867
},
{
"x": 1231.15955505978,
"y": 1387.6120546200152
},
{
"x": 1094.1849051394036,
"y": 1333.9997915976057
},
{
"x": 1185.8183133413556,
"y": 1411.0123305541617
},
{
"x": 1143.6619841289478,
"y": 1348.0486231266118
},
{
"x": 1109.236402647436,
"y": 1305.372749706587
},
{
"x": 1092.9665591634273,
"y": 1305.500654343196
},
{
"x": 1173.0679336762444,
"y": 1374.8488273479245
},
{
"x": 1107.3610198723125,
"y": 1280.4033184661102
},
{
"x": 1022.7077231031074,
"y": 1251.9613215452066
},
{
"x": 1088.2300964411208,
"y": 1291.8039032119614
},
{
"x": 1187.8162431488788,
"y": 1393.7403470957352
},
{
"x": 1073.8466168425755,
"y": 1291.3763145327605
},
{
"x": 1036.2787541798089,
"y": 1254.942602963758
},
{
"x": 1189.338164000971,
"y": 1390.89214598958
},
{
"x": 1095.2261741253624,
"y": 1301.210453596837
},
{
"x": 1070.8308895787547,
"y": 1285.503754404087
},
{
"x": 1080.6744856262542,
"y": 1293.7965594679467
},
{
"x": 1081.5116160833911,
"y": 1268.4869985560397
}
]
}
],
"drilldown": {},
"tooltip": {
"enabled": true,
"useHTML": false,
"format": null,
"headerFormat": "",
"pointFormat": "<span style=\"color:{series.color}\">Single</span>: <b>{point.x:.0f}</b><br><span style=\"color:{series.color}\">Multi</span>: <b>{point.y:.0f}</b>",
"footerFormat": "",
"shared": false,
"outside": false,
"valueDecimals": null,
"split": false
},
"annotations": null
},
"hc_type": "chart",
"id": "329514925940350364806260402217036813416"
}
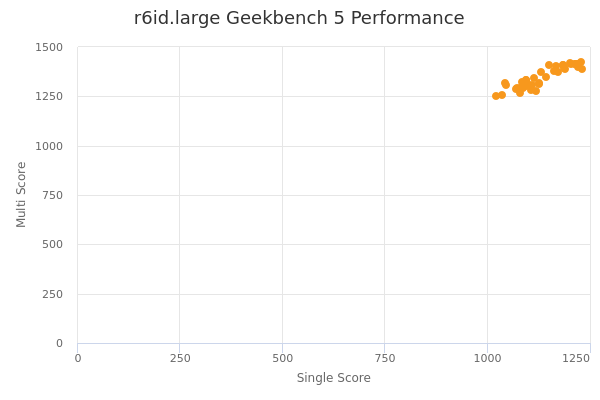
| Single | Multi | |
|---|---|---|
| Max | 1231 | 1425 |
| Average | 1136 | 1348 |
| Deviation | 60.03 | 54.16 |
| Min | 1023 | 1252 |
Sign up as Freemium to get more insight.