m6i.metal by Amazon Web Services
Geekbench is a cross-platform processor benchmark with a scoring system that determines single-core and multi-core performance using loads simulating real-world scenarios. Geekbench 5 score is calculated with a reference score of 2500 representing the performance of the Intel Core i5-2520M @ 2.50 GHz. The software benchmark is available for Mac OS, Windows, Linux, Android and iOS platforms.
Specifications:
CPU
128
RAM
512.0 GB
Net
50000 Mbps
{
"configuration": {
"chart": {
"type": "scatter",
"polar": false,
"zoomType": "",
"options3d": {},
"height": null,
"width": null,
"margin": null,
"inverted": false,
"zooming": {}
},
"credits": {
"enabled": false
},
"title": {
"text": ""
},
"colorAxis": null,
"subtitle": {
"text": ""
},
"xAxis": {
"title": {
"text": [
"Single Score"
],
"useHTML": false,
"style": {
"color": "#666666"
}
},
"categories": null,
"lineWidth": 1,
"tickInterval": null,
"tickWidth": 1,
"tickLength": 10,
"tickPixelInterval": 100,
"plotLines": null,
"labels": {
"enabled": true,
"format": null,
"formatter": "",
"style": {
"color": "#666666",
"cursor": "default",
"fontSize": "11px"
},
"useHTML": false,
"step": 0
},
"plotBands": null,
"visible": true,
"floor": null,
"ceiling": null,
"type": "linear",
"min": 0,
"gridLineWidth": 1,
"gridLineColor": "#e6e6e6",
"minorTickInterval": null,
"minorTickWidth": 0,
"minTickInterval": null,
"startOnTick": true,
"endOnTick": true,
"tickmarkPlacement": 100,
"units": 100,
"minRange": 100
},
"yAxis": {
"title": {
"text": [
"Multi Score"
],
"useHTML": false,
"style": {
"color": "#666666"
}
},
"categories": null,
"plotLines": null,
"plotBands": null,
"lineWidth": null,
"tickInterval": null,
"tickLength": 10,
"floor": null,
"ceiling": null,
"gridLineInterpolation": null,
"gridLineWidth": 1,
"gridLineColor": "#e6e6e6",
"min": 0,
"max": null,
"minorTickInterval": null,
"minorTickWidth": 0,
"minTickInterval": null,
"startOnTick": true,
"endOnTick": true,
"minRange": null,
"type": "linear",
"tickmarkPlacement": null,
"labels": {
"enabled": true,
"formatter": null,
"style": {
"color": "#666666",
"cursor": "default",
"fontSize": "11px"
},
"useHTML": false
}
},
"zAxis": {
"title": {
"text": "Multi Score"
}
},
"plotOptions": {
"series": {
"dataLabels": {
"enabled": false,
"format": null,
"distance": 30,
"align": "center",
"inside": null,
"allowOverlap": false,
"style": {
"fontSize": "11px"
}
},
"showInLegend": null,
"turboThreshold": 0,
"stacking": "",
"groupPadding": 0.2,
"centerInCategory": false,
"findNearestPointBy": "x"
}
},
"navigator": {
"enabled": false
},
"scrollbar": {
"enabled": false
},
"rangeSelector": {
"enabled": false,
"inputEnabled": false
},
"legend": {
"enabled": null,
"maxHeight": null,
"align": "center",
"verticalAlign": "bottom",
"layout": "horizontal",
"width": null,
"margin": 12,
"reversed": false
},
"series": [
{
"name": "m6i.metal by Amazon Web Services",
"color": "#f7981d",
"data": [
{
"x": 1173.724825559204,
"y": 45452.32120245441
},
{
"x": 1206.826028318089,
"y": 45451.13873786014
},
{
"x": 1183.5743149889477,
"y": 45474.37673839206
},
{
"x": 1203.507211698825,
"y": 44918.585905537046
},
{
"x": 1246.7473712700137,
"y": 44691.12405332718
},
{
"x": 1074.806194837321,
"y": 45156.9157565409
},
{
"x": 1164.8534007693388,
"y": 44928.31221408981
},
{
"x": 1202.4159242320377,
"y": 45505.52708258057
},
{
"x": 1207.7164260743798,
"y": 46039.26638178415
},
{
"x": 1181.6975360100164,
"y": 45302.130723317954
},
{
"x": 1118.308209934873,
"y": 46020.353891665036
},
{
"x": 1217.8946781302793,
"y": 46424.26069765794
},
{
"x": 1139.0716870974657,
"y": 46357.776321003534
},
{
"x": 1148.8907344812353,
"y": 46080.71442761787
},
{
"x": 1222.3066840330127,
"y": 45582.115672106425
},
{
"x": 1220.0266817964998,
"y": 46426.47554103904
},
{
"x": 1145.6406099103347,
"y": 46013.30033760632
},
{
"x": 1178.4003463544595,
"y": 46146.668857102304
},
{
"x": 1188.0440724808125,
"y": 47316.36203562141
},
{
"x": 1217.7837903874663,
"y": 45428.478024368735
},
{
"x": 1146.5453673535212,
"y": 46891.61922263108
},
{
"x": 1215.4278171193382,
"y": 44460.74143289168
},
{
"x": 1159.642213974635,
"y": 47515.23941936043
},
{
"x": 1216.187836800291,
"y": 46350.934057924314
},
{
"x": 1220.0288499442618,
"y": 45700.43512973758
},
{
"x": 1219.6704651694229,
"y": 46040.72576621539
},
{
"x": 1221.3037100379884,
"y": 46592.302655810665
},
{
"x": 1246.2308566334223,
"y": 46293.303220623486
},
{
"x": 1141.8788561453594,
"y": 44830.29021828381
},
{
"x": 1241.669173476134,
"y": 46212.77120463738
}
]
}
],
"drilldown": {},
"tooltip": {
"enabled": true,
"useHTML": false,
"format": null,
"headerFormat": "",
"pointFormat": "<span style=\"color:{series.color}\">Single</span>: <b>{point.x:.0f}</b><br><span style=\"color:{series.color}\">Multi</span>: <b>{point.y:.0f}</b>",
"footerFormat": "",
"shared": false,
"outside": false,
"valueDecimals": null,
"split": false
},
"annotations": null
},
"hc_type": "chart",
"id": "267087344636324268688773944364788396952"
}
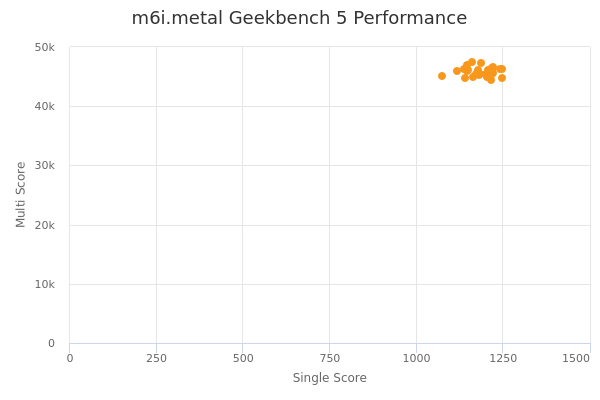
| Single | Multi | |
|---|---|---|
| Max | 1247 | 47515 |
| Average | 1189 | 45853 |
| Deviation | 40.20 | 729.98 |
| Min | 1075 | 44461 |
Sign up as Freemium to get more insight.