m6i.32xlarge by Amazon Web Services
Geekbench is a cross-platform processor benchmark with a scoring system that determines single-core and multi-core performance using loads simulating real-world scenarios. Geekbench 5 score is calculated with a reference score of 2500 representing the performance of the Intel Core i5-2520M @ 2.50 GHz. The software benchmark is available for Mac OS, Windows, Linux, Android and iOS platforms.
Specifications:
CPU
128
RAM
512.0 GB
Net
50000 Mbps
{
"configuration": {
"chart": {
"type": "scatter",
"polar": false,
"zoomType": "",
"options3d": {},
"height": null,
"width": null,
"margin": null,
"inverted": false,
"zooming": {}
},
"credits": {
"enabled": false
},
"title": {
"text": ""
},
"colorAxis": null,
"subtitle": {
"text": ""
},
"xAxis": {
"title": {
"text": [
"Single Score"
],
"useHTML": false,
"style": {
"color": "#666666"
}
},
"categories": null,
"lineWidth": 1,
"tickInterval": null,
"tickWidth": 1,
"tickLength": 10,
"tickPixelInterval": 100,
"plotLines": null,
"labels": {
"enabled": true,
"format": null,
"formatter": "",
"style": {
"color": "#666666",
"cursor": "default",
"fontSize": "11px"
},
"useHTML": false,
"step": 0
},
"plotBands": null,
"visible": true,
"floor": null,
"ceiling": null,
"type": "linear",
"min": 0,
"gridLineWidth": 1,
"gridLineColor": "#e6e6e6",
"minorTickInterval": null,
"minorTickWidth": 0,
"minTickInterval": null,
"startOnTick": true,
"endOnTick": true,
"tickmarkPlacement": 100,
"units": 100,
"minRange": 100
},
"yAxis": {
"title": {
"text": [
"Multi Score"
],
"useHTML": false,
"style": {
"color": "#666666"
}
},
"categories": null,
"plotLines": null,
"plotBands": null,
"lineWidth": null,
"tickInterval": null,
"tickLength": 10,
"floor": null,
"ceiling": null,
"gridLineInterpolation": null,
"gridLineWidth": 1,
"gridLineColor": "#e6e6e6",
"min": 0,
"max": null,
"minorTickInterval": null,
"minorTickWidth": 0,
"minTickInterval": null,
"startOnTick": true,
"endOnTick": true,
"minRange": null,
"type": "linear",
"tickmarkPlacement": null,
"labels": {
"enabled": true,
"formatter": null,
"style": {
"color": "#666666",
"cursor": "default",
"fontSize": "11px"
},
"useHTML": false
}
},
"zAxis": {
"title": {
"text": "Multi Score"
}
},
"plotOptions": {
"series": {
"dataLabels": {
"enabled": false,
"format": null,
"distance": 30,
"align": "center",
"inside": null,
"allowOverlap": false,
"style": {
"fontSize": "11px"
}
},
"showInLegend": null,
"turboThreshold": 0,
"stacking": "",
"groupPadding": 0.2,
"centerInCategory": false,
"findNearestPointBy": "x"
}
},
"navigator": {
"enabled": false
},
"scrollbar": {
"enabled": false
},
"rangeSelector": {
"enabled": false,
"inputEnabled": false
},
"legend": {
"enabled": null,
"maxHeight": null,
"align": "center",
"verticalAlign": "bottom",
"layout": "horizontal",
"width": null,
"margin": 12,
"reversed": false
},
"series": [
{
"name": "m6i.32xlarge by Amazon Web Services",
"color": "#f7981d",
"data": [
{
"x": 1254.7350331311168,
"y": 52115.21136217787
},
{
"x": 1244.5995550246773,
"y": 52108.38059645208
},
{
"x": 1250.7914226596229,
"y": 53146.10253252422
},
{
"x": 1241.2076960519323,
"y": 51138.12414020515
},
{
"x": 1252.7313053452103,
"y": 54135.73937272433
},
{
"x": 1241.526008473602,
"y": 53175.76988599663
},
{
"x": 1250.0930856926511,
"y": 52019.22525088114
},
{
"x": 1251.7071732893924,
"y": 52313.59348967252
},
{
"x": 1249.8096888321886,
"y": 52104.86730572567
},
{
"x": 1249.5574628890834,
"y": 50592.44260887992
},
{
"x": 1250.7719643135624,
"y": 52871.714834247614
},
{
"x": 1243.3900531693018,
"y": 52131.88757299786
},
{
"x": 1251.327231968848,
"y": 52300.01247764658
},
{
"x": 1244.6858265186129,
"y": 52348.95732989268
},
{
"x": 1250.4811849966438,
"y": 52167.249595938345
},
{
"x": 1245.3709311925381,
"y": 50859.133867704135
},
{
"x": 1250.516589667233,
"y": 51348.235388927795
},
{
"x": 1249.1205276672529,
"y": 52167.36637337116
},
{
"x": 1237.6188192736,
"y": 51575.85630145606
},
{
"x": 1250.7067405186892,
"y": 53473.86327420214
}
]
}
],
"drilldown": {},
"tooltip": {
"enabled": true,
"useHTML": false,
"format": null,
"headerFormat": "",
"pointFormat": "<span style=\"color:{series.color}\">Single</span>: <b>{point.x:.0f}</b><br><span style=\"color:{series.color}\">Multi</span>: <b>{point.y:.0f}</b>",
"footerFormat": "",
"shared": false,
"outside": false,
"valueDecimals": null,
"split": false
},
"annotations": null
},
"hc_type": "chart",
"id": "110024024776144706613817613218695206759"
}
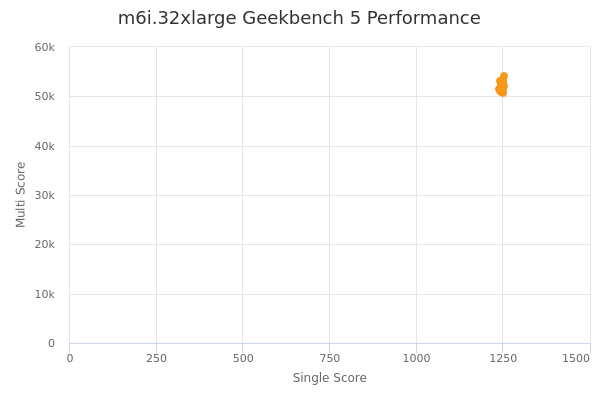
| Single | Multi | |
|---|---|---|
| Max | 1255 | 54136 |
| Average | 1248 | 52205 |
| Deviation | 4.39 | 848.58 |
| Min | 1238 | 50592 |
Sign up as Freemium to get more insight.