m6i.xlarge by Amazon Web Services
Geekbench is a cross-platform processor benchmark with a scoring system that determines single-core and multi-core performance using loads simulating real-world scenarios. Geekbench 5 score is calculated with a reference score of 2500 representing the performance of the Intel Core i5-2520M @ 2.50 GHz. The software benchmark is available for Mac OS, Windows, Linux, Android and iOS platforms.
Specifications:
CPU
4
RAM
16.0 GB
Net
12500 Mbps
{
"configuration": {
"chart": {
"type": "scatter",
"polar": false,
"zoomType": "",
"options3d": {},
"height": null,
"width": null,
"margin": null,
"inverted": false,
"zooming": {}
},
"credits": {
"enabled": false
},
"title": {
"text": ""
},
"colorAxis": null,
"subtitle": {
"text": ""
},
"xAxis": {
"title": {
"text": [
"Single Score"
],
"useHTML": false,
"style": {
"color": "#666666"
}
},
"categories": null,
"lineWidth": 1,
"tickInterval": null,
"tickWidth": 1,
"tickLength": 10,
"tickPixelInterval": 100,
"plotLines": null,
"labels": {
"enabled": true,
"format": null,
"formatter": "",
"style": {
"color": "#666666",
"cursor": "default",
"fontSize": "11px"
},
"useHTML": false,
"step": 0
},
"plotBands": null,
"visible": true,
"floor": null,
"ceiling": null,
"type": "linear",
"min": 0,
"gridLineWidth": 1,
"gridLineColor": "#e6e6e6",
"minorTickInterval": null,
"minorTickWidth": 0,
"minTickInterval": null,
"startOnTick": true,
"endOnTick": true,
"tickmarkPlacement": 100,
"units": 100,
"minRange": 100
},
"yAxis": {
"title": {
"text": [
"Multi Score"
],
"useHTML": false,
"style": {
"color": "#666666"
}
},
"categories": null,
"plotLines": null,
"plotBands": null,
"lineWidth": null,
"tickInterval": null,
"tickLength": 10,
"floor": null,
"ceiling": null,
"gridLineInterpolation": null,
"gridLineWidth": 1,
"gridLineColor": "#e6e6e6",
"min": 0,
"max": null,
"minorTickInterval": null,
"minorTickWidth": 0,
"minTickInterval": null,
"startOnTick": true,
"endOnTick": true,
"minRange": null,
"type": "linear",
"tickmarkPlacement": null,
"labels": {
"enabled": true,
"formatter": null,
"style": {
"color": "#666666",
"cursor": "default",
"fontSize": "11px"
},
"useHTML": false
}
},
"zAxis": {
"title": {
"text": "Multi Score"
}
},
"plotOptions": {
"series": {
"dataLabels": {
"enabled": false,
"format": null,
"distance": 30,
"align": "center",
"inside": null,
"allowOverlap": false,
"style": {
"fontSize": "11px"
}
},
"showInLegend": null,
"turboThreshold": 0,
"stacking": "",
"groupPadding": 0.2,
"centerInCategory": false,
"findNearestPointBy": "x"
}
},
"navigator": {
"enabled": false
},
"scrollbar": {
"enabled": false
},
"rangeSelector": {
"enabled": false,
"inputEnabled": false
},
"legend": {
"enabled": null,
"maxHeight": null,
"align": "center",
"verticalAlign": "bottom",
"layout": "horizontal",
"width": null,
"margin": 12,
"reversed": false
},
"series": [
{
"name": "m6i.xlarge by Amazon Web Services",
"color": "#f7981d",
"data": [
{
"x": 1256.4572440766651,
"y": 2819.5718648676852
},
{
"x": 1238.099630595304,
"y": 2823.0867180111504
},
{
"x": 1257.5746637207867,
"y": 2820.858251208554
},
{
"x": 1258.7780122547097,
"y": 2802.292658437666
},
{
"x": 1259.2965926388956,
"y": 2826.4523982784426
},
{
"x": 1241.3590204673842,
"y": 2810.1125272123945
},
{
"x": 1263.1600434974216,
"y": 2834.6106144278037
},
{
"x": 1240.5717561354063,
"y": 2816.0097586724137
},
{
"x": 1258.8618182609005,
"y": 2837.699224176489
},
{
"x": 1243.0648146092421,
"y": 2820.4157749536826
},
{
"x": 1261.2126464212786,
"y": 2833.5385144912284
},
{
"x": 1242.7288670059102,
"y": 2817.0821738832174
},
{
"x": 1250.973120805511,
"y": 2830.3202331133125
},
{
"x": 1235.6587725471468,
"y": 2815.748484653106
},
{
"x": 1253.626534317728,
"y": 2833.1636036224872
},
{
"x": 1241.6054100058875,
"y": 2809.9131769206724
},
{
"x": 1262.7124939103912,
"y": 2830.6781419063263
},
{
"x": 1238.1475394245426,
"y": 2816.638957273425
},
{
"x": 1262.3920213623023,
"y": 2828.857396396779
},
{
"x": 1239.890435158851,
"y": 2819.2624728175306
},
{
"x": 1210.2910511654054,
"y": 2778.370633087181
},
{
"x": 1181.6364467831254,
"y": 2713.1041305520625
},
{
"x": 1202.8081247716864,
"y": 2783.0515207255185
},
{
"x": 1186.9154385111742,
"y": 2730.030416285197
},
{
"x": 1205.915349693712,
"y": 2777.724852788482
},
{
"x": 1175.7132237699795,
"y": 2755.6885935585324
},
{
"x": 1200.693340526984,
"y": 2786.1527670452588
},
{
"x": 1200.8099496952602,
"y": 2743.95543969699
},
{
"x": 1210.6212096069132,
"y": 2793.281284912069
},
{
"x": 1190.5808769109667,
"y": 2757.9149361024706
},
{
"x": 1220.373645622389,
"y": 2788.83606699841
},
{
"x": 1199.0492883285783,
"y": 2758.7567559610598
},
{
"x": 1213.435399946267,
"y": 2784.176295453542
},
{
"x": 1192.6806077020888,
"y": 2751.42247425984
},
{
"x": 1210.8239689451116,
"y": 2792.89244918215
},
{
"x": 1197.2987261545336,
"y": 2760.360455923987
},
{
"x": 1215.5879465197881,
"y": 2784.9714745015917
},
{
"x": 1196.3521732066376,
"y": 2768.134610163963
},
{
"x": 1211.3427520762277,
"y": 2783.1896904032374
},
{
"x": 1190.9960330303477,
"y": 2753.1697563711946
}
]
}
],
"drilldown": {},
"tooltip": {
"enabled": true,
"useHTML": false,
"format": null,
"headerFormat": "",
"pointFormat": "<span style=\"color:{series.color}\">Single</span>: <b>{point.x:.0f}</b><br><span style=\"color:{series.color}\">Multi</span>: <b>{point.y:.0f}</b>",
"footerFormat": "",
"shared": false,
"outside": false,
"valueDecimals": null,
"split": false
},
"annotations": null
},
"hc_type": "chart",
"id": "34593678070143864031131484143116211391"
}
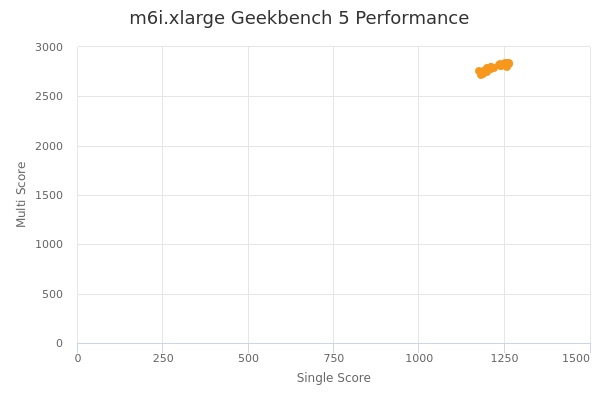
| Single | Multi | |
|---|---|---|
| Max | 1263 | 2838 |
| Average | 1226 | 2795 |
| Deviation | 27.01 | 32.08 |
| Min | 1176 | 2713 |
Sign up as Freemium to get more insight.