m6i.24xlarge by Amazon Web Services
Geekbench is a cross-platform processor benchmark with a scoring system that determines single-core and multi-core performance using loads simulating real-world scenarios. Geekbench 5 score is calculated with a reference score of 2500 representing the performance of the Intel Core i5-2520M @ 2.50 GHz. The software benchmark is available for Mac OS, Windows, Linux, Android and iOS platforms.
Specifications:
CPU
96
RAM
384.0 GB
Net
37500 Mbps
{
"configuration": {
"chart": {
"type": "scatter",
"polar": false,
"zoomType": "",
"options3d": {},
"height": null,
"width": null,
"margin": null,
"inverted": false,
"zooming": {}
},
"credits": {
"enabled": false
},
"title": {
"text": ""
},
"colorAxis": null,
"subtitle": {
"text": ""
},
"xAxis": {
"title": {
"text": [
"Single Score"
],
"useHTML": false,
"style": {
"color": "#666666"
}
},
"categories": null,
"lineWidth": 1,
"tickInterval": null,
"tickWidth": 1,
"tickLength": 10,
"tickPixelInterval": 100,
"plotLines": null,
"labels": {
"enabled": true,
"format": null,
"formatter": "",
"style": {
"color": "#666666",
"cursor": "default",
"fontSize": "11px"
},
"useHTML": false,
"step": 0
},
"plotBands": null,
"visible": true,
"floor": null,
"ceiling": null,
"type": "linear",
"min": 0,
"gridLineWidth": 1,
"gridLineColor": "#e6e6e6",
"minorTickInterval": null,
"minorTickWidth": 0,
"minTickInterval": null,
"startOnTick": true,
"endOnTick": true,
"tickmarkPlacement": 100,
"units": 100,
"minRange": 100
},
"yAxis": {
"title": {
"text": [
"Multi Score"
],
"useHTML": false,
"style": {
"color": "#666666"
}
},
"categories": null,
"plotLines": null,
"plotBands": null,
"lineWidth": null,
"tickInterval": null,
"tickLength": 10,
"floor": null,
"ceiling": null,
"gridLineInterpolation": null,
"gridLineWidth": 1,
"gridLineColor": "#e6e6e6",
"min": 0,
"max": null,
"minorTickInterval": null,
"minorTickWidth": 0,
"minTickInterval": null,
"startOnTick": true,
"endOnTick": true,
"minRange": null,
"type": "linear",
"tickmarkPlacement": null,
"labels": {
"enabled": true,
"formatter": null,
"style": {
"color": "#666666",
"cursor": "default",
"fontSize": "11px"
},
"useHTML": false
}
},
"zAxis": {
"title": {
"text": "Multi Score"
}
},
"plotOptions": {
"series": {
"dataLabels": {
"enabled": false,
"format": null,
"distance": 30,
"align": "center",
"inside": null,
"allowOverlap": false,
"style": {
"fontSize": "11px"
}
},
"showInLegend": null,
"turboThreshold": 0,
"stacking": "",
"groupPadding": 0.2,
"centerInCategory": false,
"findNearestPointBy": "x"
}
},
"navigator": {
"enabled": false
},
"scrollbar": {
"enabled": false
},
"rangeSelector": {
"enabled": false,
"inputEnabled": false
},
"legend": {
"enabled": null,
"maxHeight": null,
"align": "center",
"verticalAlign": "bottom",
"layout": "horizontal",
"width": null,
"margin": 12,
"reversed": false
},
"series": [
{
"name": "m6i.24xlarge by Amazon Web Services",
"color": "#f7981d",
"data": [
{
"x": 1238.4751586937225,
"y": 41397.48279648275
},
{
"x": 1247.4203572704307,
"y": 42858.84309623874
},
{
"x": 1230.2931543435323,
"y": 43428.35407447933
},
{
"x": 1256.9293340551624,
"y": 40827.67746477663
},
{
"x": 1231.5178468225936,
"y": 42338.32548703096
},
{
"x": 1256.6095945236436,
"y": 42216.32739123044
},
{
"x": 1232.8911330176043,
"y": 42134.92194296915
},
{
"x": 1258.473392986235,
"y": 40955.318508426084
},
{
"x": 1238.8649951525038,
"y": 43541.74581550056
},
{
"x": 1256.2290014960024,
"y": 41845.46096722211
},
{
"x": 1221.6082852527993,
"y": 41505.075910999694
},
{
"x": 1256.0285436354761,
"y": 40244.17132855853
},
{
"x": 1255.0606443637375,
"y": 41520.22505478212
},
{
"x": 1219.116129153263,
"y": 43625.48321621807
},
{
"x": 1250.0572674193797,
"y": 42180.34627502212
},
{
"x": 1223.8539140206606,
"y": 42577.6094668058
},
{
"x": 1250.5280045430197,
"y": 41322.88096241462
},
{
"x": 1231.573402384196,
"y": 41924.983697661286
},
{
"x": 1255.437067614275,
"y": 41415.7641416866
},
{
"x": 1214.250080836928,
"y": 42031.398568627104
},
{
"x": 1253.104424633893,
"y": 41921.546721018225
},
{
"x": 1246.9331856318208,
"y": 41919.927828602136
},
{
"x": 1263.7637301648022,
"y": 42932.111135999134
},
{
"x": 1245.2416469223504,
"y": 41483.22744989304
},
{
"x": 1240.1028580243544,
"y": 42641.730745194334
},
{
"x": 1249.9645332631492,
"y": 42762.15410714335
},
{
"x": 1255.4313873959923,
"y": 43946.34767453954
},
{
"x": 1255.985390972288,
"y": 42382.09111421489
},
{
"x": 1241.3076817031076,
"y": 43057.010961944965
},
{
"x": 1260.8187915083577,
"y": 42280.994417510665
}
]
}
],
"drilldown": {},
"tooltip": {
"enabled": true,
"useHTML": false,
"format": null,
"headerFormat": "",
"pointFormat": "<span style=\"color:{series.color}\">Single</span>: <b>{point.x:.0f}</b><br><span style=\"color:{series.color}\">Multi</span>: <b>{point.y:.0f}</b>",
"footerFormat": "",
"shared": false,
"outside": false,
"valueDecimals": null,
"split": false
},
"annotations": null
},
"hc_type": "chart",
"id": "235379304979379363740246296503132012766"
}
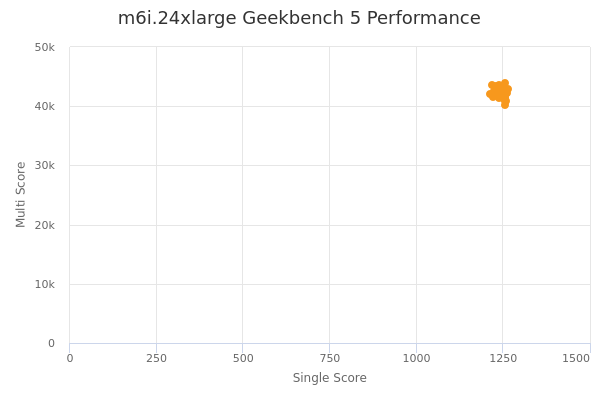
| Single | Multi | |
|---|---|---|
| Max | 1264 | 43946 |
| Average | 1245 | 42174 |
| Deviation | 13.36 | 854.85 |
| Min | 1214 | 40244 |
Sign up as Freemium to get more insight.