m6i.large by Amazon Web Services
Geekbench is a cross-platform processor benchmark with a scoring system that determines single-core and multi-core performance using loads simulating real-world scenarios. Geekbench 5 score is calculated with a reference score of 2500 representing the performance of the Intel Core i5-2520M @ 2.50 GHz. The software benchmark is available for Mac OS, Windows, Linux, Android and iOS platforms.
Specifications:
CPU
2
RAM
8.0 GB
Net
12500 Mbps
{
"configuration": {
"chart": {
"type": "scatter",
"polar": false,
"zoomType": "",
"options3d": {},
"height": null,
"width": null,
"margin": null,
"inverted": false,
"zooming": {}
},
"credits": {
"enabled": false
},
"title": {
"text": ""
},
"colorAxis": null,
"subtitle": {
"text": ""
},
"xAxis": {
"title": {
"text": [
"Single Score"
],
"useHTML": false,
"style": {
"color": "#666666"
}
},
"categories": null,
"lineWidth": 1,
"tickInterval": null,
"tickWidth": 1,
"tickLength": 10,
"tickPixelInterval": 100,
"plotLines": null,
"labels": {
"enabled": true,
"format": null,
"formatter": "",
"style": {
"color": "#666666",
"cursor": "default",
"fontSize": "11px"
},
"useHTML": false,
"step": 0
},
"plotBands": null,
"visible": true,
"floor": null,
"ceiling": null,
"type": "linear",
"min": 0,
"gridLineWidth": 1,
"gridLineColor": "#e6e6e6",
"minorTickInterval": null,
"minorTickWidth": 0,
"minTickInterval": null,
"startOnTick": true,
"endOnTick": true,
"tickmarkPlacement": 100,
"units": 100,
"minRange": 100
},
"yAxis": {
"title": {
"text": [
"Multi Score"
],
"useHTML": false,
"style": {
"color": "#666666"
}
},
"categories": null,
"plotLines": null,
"plotBands": null,
"lineWidth": null,
"tickInterval": null,
"tickLength": 10,
"floor": null,
"ceiling": null,
"gridLineInterpolation": null,
"gridLineWidth": 1,
"gridLineColor": "#e6e6e6",
"min": 0,
"max": null,
"minorTickInterval": null,
"minorTickWidth": 0,
"minTickInterval": null,
"startOnTick": true,
"endOnTick": true,
"minRange": null,
"type": "linear",
"tickmarkPlacement": null,
"labels": {
"enabled": true,
"formatter": null,
"style": {
"color": "#666666",
"cursor": "default",
"fontSize": "11px"
},
"useHTML": false
}
},
"zAxis": {
"title": {
"text": "Multi Score"
}
},
"plotOptions": {
"series": {
"dataLabels": {
"enabled": false,
"format": null,
"distance": 30,
"align": "center",
"inside": null,
"allowOverlap": false,
"style": {
"fontSize": "11px"
}
},
"showInLegend": null,
"turboThreshold": 0,
"stacking": "",
"groupPadding": 0.2,
"centerInCategory": false,
"findNearestPointBy": "x"
}
},
"navigator": {
"enabled": false
},
"scrollbar": {
"enabled": false
},
"rangeSelector": {
"enabled": false,
"inputEnabled": false
},
"legend": {
"enabled": null,
"maxHeight": null,
"align": "center",
"verticalAlign": "bottom",
"layout": "horizontal",
"width": null,
"margin": 12,
"reversed": false
},
"series": [
{
"name": "m6i.large by Amazon Web Services",
"color": "#f7981d",
"data": [
{
"x": 1261.4013115286373,
"y": 1444.6058846951466
},
{
"x": 1242.6045806450843,
"y": 1442.717559009463
},
{
"x": 1260.9681982087982,
"y": 1447.2716836515317
},
{
"x": 1244.7868690847126,
"y": 1440.9036323344956
},
{
"x": 1257.833325026355,
"y": 1450.4448407638886
},
{
"x": 1249.4627417167983,
"y": 1442.6835744262864
},
{
"x": 1246.1692451076729,
"y": 1438.391706958115
},
{
"x": 1258.7647478934193,
"y": 1447.9714712549346
},
{
"x": 1258.3723882137415,
"y": 1450.1335201923107
},
{
"x": 1246.3165075092816,
"y": 1443.430758526929
},
{
"x": 1259.188999270048,
"y": 1451.5834356079451
},
{
"x": 1253.2754864678873,
"y": 1445.6039118119902
},
{
"x": 1255.0560072408791,
"y": 1446.5370370596668
},
{
"x": 1248.9881634723047,
"y": 1439.4954547179982
},
{
"x": 1255.3662488113364,
"y": 1450.8587434595206
},
{
"x": 1248.8181177443023,
"y": 1444.31790293211
},
{
"x": 1261.2862000277782,
"y": 1445.8402689413745
},
{
"x": 1247.305970284237,
"y": 1443.7770738682389
},
{
"x": 1263.6443977939261,
"y": 1453.0970861851188
},
{
"x": 1252.7606999394425,
"y": 1445.1621066197185
},
{
"x": 1229.7941267574606,
"y": 1424.4903535649764
},
{
"x": 1206.4699305874317,
"y": 1416.4181501716528
},
{
"x": 1223.5367270665404,
"y": 1425.1495535353752
},
{
"x": 1220.6485051399095,
"y": 1417.5249602863869
},
{
"x": 1231.3225591240764,
"y": 1418.7662487417215
},
{
"x": 1214.349735193363,
"y": 1419.027759242953
},
{
"x": 1234.339287774866,
"y": 1428.7276392398244
},
{
"x": 1222.9973224562643,
"y": 1416.9468939086016
},
{
"x": 1228.5459174609703,
"y": 1423.3478739812472
},
{
"x": 1215.5962033285846,
"y": 1425.0730051988965
},
{
"x": 1223.0955803492732,
"y": 1424.668281063641
},
{
"x": 1219.2155115103396,
"y": 1404.1032271377278
},
{
"x": 1228.5032988607288,
"y": 1426.360908881391
},
{
"x": 1212.775747710893,
"y": 1408.7650813291582
},
{
"x": 1222.20207138232,
"y": 1420.493993155581
},
{
"x": 1197.935204215451,
"y": 1402.911912344327
},
{
"x": 1225.7073837467585,
"y": 1430.2576130022455
},
{
"x": 1210.277826874164,
"y": 1426.420673985287
},
{
"x": 1222.8187870457812,
"y": 1412.8864177289756
},
{
"x": 1209.4374347531525,
"y": 1413.041544513862
}
]
}
],
"drilldown": {},
"tooltip": {
"enabled": true,
"useHTML": false,
"format": null,
"headerFormat": "",
"pointFormat": "<span style=\"color:{series.color}\">Single</span>: <b>{point.x:.0f}</b><br><span style=\"color:{series.color}\">Multi</span>: <b>{point.y:.0f}</b>",
"footerFormat": "",
"shared": false,
"outside": false,
"valueDecimals": null,
"split": false
},
"annotations": null
},
"hc_type": "chart",
"id": "190397574934040348656744420879459038906"
}
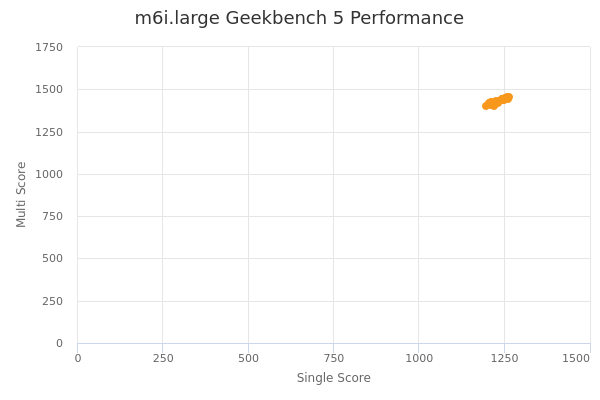
| Single | Multi | |
|---|---|---|
| Max | 1264 | 1453 |
| Average | 1237 | 1433 |
| Deviation | 18.53 | 14.56 |
| Min | 1198 | 1403 |
Sign up as Freemium to get more insight.