m6a.metal by Amazon Web Services
Geekbench is a cross-platform processor benchmark with a scoring system that determines single-core and multi-core performance using loads simulating real-world scenarios. Geekbench 5 score is calculated with a reference score of 2500 representing the performance of the Intel Core i5-2520M @ 2.50 GHz. The software benchmark is available for Mac OS, Windows, Linux, Android and iOS platforms.
Specifications:
CPU
192
RAM
768.0 GB
Net
50000 Mbps
{
"configuration": {
"chart": {
"type": "scatter",
"polar": false,
"zoomType": "",
"options3d": {},
"height": null,
"width": null,
"margin": null,
"inverted": false,
"zooming": {}
},
"credits": {
"enabled": false
},
"title": {
"text": ""
},
"colorAxis": null,
"subtitle": {
"text": ""
},
"xAxis": {
"title": {
"text": [
"Single Score"
],
"useHTML": false,
"style": {
"color": "#666666"
}
},
"categories": null,
"lineWidth": 1,
"tickInterval": null,
"tickWidth": 1,
"tickLength": 10,
"tickPixelInterval": 100,
"plotLines": null,
"labels": {
"enabled": true,
"format": null,
"formatter": "",
"style": {
"color": "#666666",
"cursor": "default",
"fontSize": "11px"
},
"useHTML": false,
"step": 0
},
"plotBands": null,
"visible": true,
"floor": null,
"ceiling": null,
"type": "linear",
"min": 0,
"gridLineWidth": 1,
"gridLineColor": "#e6e6e6",
"minorTickInterval": null,
"minorTickWidth": 0,
"minTickInterval": null,
"startOnTick": true,
"endOnTick": true,
"tickmarkPlacement": 100,
"units": 100,
"minRange": 100
},
"yAxis": {
"title": {
"text": [
"Multi Score"
],
"useHTML": false,
"style": {
"color": "#666666"
}
},
"categories": null,
"plotLines": null,
"plotBands": null,
"lineWidth": null,
"tickInterval": null,
"tickLength": 10,
"floor": null,
"ceiling": null,
"gridLineInterpolation": null,
"gridLineWidth": 1,
"gridLineColor": "#e6e6e6",
"min": 0,
"max": null,
"minorTickInterval": null,
"minorTickWidth": 0,
"minTickInterval": null,
"startOnTick": true,
"endOnTick": true,
"minRange": null,
"type": "linear",
"tickmarkPlacement": null,
"labels": {
"enabled": true,
"formatter": null,
"style": {
"color": "#666666",
"cursor": "default",
"fontSize": "11px"
},
"useHTML": false
}
},
"zAxis": {
"title": {
"text": "Multi Score"
}
},
"plotOptions": {
"series": {
"dataLabels": {
"enabled": false,
"format": null,
"distance": 30,
"align": "center",
"inside": null,
"allowOverlap": false,
"style": {
"fontSize": "11px"
}
},
"showInLegend": null,
"turboThreshold": 0,
"stacking": "",
"groupPadding": 0.2,
"centerInCategory": false,
"findNearestPointBy": "x"
}
},
"navigator": {
"enabled": false
},
"scrollbar": {
"enabled": false
},
"rangeSelector": {
"enabled": false,
"inputEnabled": false
},
"legend": {
"enabled": null,
"maxHeight": null,
"align": "center",
"verticalAlign": "bottom",
"layout": "horizontal",
"width": null,
"margin": 12,
"reversed": false
},
"series": [
{
"name": "m6a.metal by Amazon Web Services",
"color": "#f7981d",
"data": [
{
"x": 1377.3628760491988,
"y": 63335.31644338061
},
{
"x": 1372.2958773081828,
"y": 59960.375627520356
},
{
"x": 1371.4725725037915,
"y": 59814.11442974969
},
{
"x": 1367.5756448314983,
"y": 63525.373262046196
},
{
"x": 1376.5389035989838,
"y": 60651.39031759872
},
{
"x": 1371.1318965726978,
"y": 63182.07783192429
},
{
"x": 1369.160779863773,
"y": 66123.84862393905
},
{
"x": 1371.7348741376852,
"y": 63751.86822275886
},
{
"x": 1373.4372175554934,
"y": 63771.733575666556
},
{
"x": 1370.6532771767966,
"y": 62130.40760673561
},
{
"x": 1371.2414959550804,
"y": 61194.56775520962
},
{
"x": 1369.5875072328563,
"y": 59162.74014305091
},
{
"x": 1369.9851225301315,
"y": 63166.47384902208
},
{
"x": 1372.0235347827447,
"y": 62912.859503185755
},
{
"x": 1374.4006715353717,
"y": 63154.00161119868
},
{
"x": 1368.067206822561,
"y": 57670.625466732614
},
{
"x": 1371.502290434338,
"y": 60076.29456231861
},
{
"x": 1369.6639031853665,
"y": 60603.35253466383
},
{
"x": 1370.6634975423096,
"y": 56789.59458335824
},
{
"x": 1374.1422310507912,
"y": 60820.59544283446
}
]
}
],
"drilldown": {},
"tooltip": {
"enabled": true,
"useHTML": false,
"format": null,
"headerFormat": "",
"pointFormat": "<span style=\"color:{series.color}\">Single</span>: <b>{point.x:.0f}</b><br><span style=\"color:{series.color}\">Multi</span>: <b>{point.y:.0f}</b>",
"footerFormat": "",
"shared": false,
"outside": false,
"valueDecimals": null,
"split": false
},
"annotations": null
},
"hc_type": "chart",
"id": "58047929361307911339106439114518429052"
}
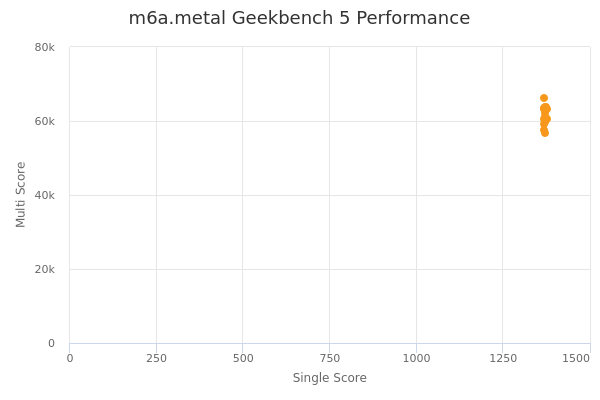
| Single | Multi | |
|---|---|---|
| Max | 1377 | 66124 |
| Average | 1372 | 61590 |
| Deviation | 2.48 | 2250.44 |
| Min | 1368 | 56790 |
Sign up as Freemium to get more insight.