m6a.2xlarge by Amazon Web Services
Geekbench is a cross-platform processor benchmark with a scoring system that determines single-core and multi-core performance using loads simulating real-world scenarios. Geekbench 5 score is calculated with a reference score of 2500 representing the performance of the Intel Core i5-2520M @ 2.50 GHz. The software benchmark is available for Mac OS, Windows, Linux, Android and iOS platforms.
Specifications:
CPU
8
RAM
32.0 GB
Net
12500 Mbps
{
"configuration": {
"chart": {
"type": "scatter",
"polar": false,
"zoomType": "",
"options3d": {},
"height": null,
"width": null,
"margin": null,
"inverted": false,
"zooming": {}
},
"credits": {
"enabled": false
},
"title": {
"text": ""
},
"colorAxis": null,
"subtitle": {
"text": ""
},
"xAxis": {
"title": {
"text": [
"Single Score"
],
"useHTML": false,
"style": {
"color": "#666666"
}
},
"categories": null,
"lineWidth": 1,
"tickInterval": null,
"tickWidth": 1,
"tickLength": 10,
"tickPixelInterval": 100,
"plotLines": null,
"labels": {
"enabled": true,
"format": null,
"formatter": "",
"style": {
"color": "#666666",
"cursor": "default",
"fontSize": "11px"
},
"useHTML": false,
"step": 0
},
"plotBands": null,
"visible": true,
"floor": null,
"ceiling": null,
"type": "linear",
"min": 0,
"gridLineWidth": 1,
"gridLineColor": "#e6e6e6",
"minorTickInterval": null,
"minorTickWidth": 0,
"minTickInterval": null,
"startOnTick": true,
"endOnTick": true,
"tickmarkPlacement": 100,
"units": 100,
"minRange": 100
},
"yAxis": {
"title": {
"text": [
"Multi Score"
],
"useHTML": false,
"style": {
"color": "#666666"
}
},
"categories": null,
"plotLines": null,
"plotBands": null,
"lineWidth": null,
"tickInterval": null,
"tickLength": 10,
"floor": null,
"ceiling": null,
"gridLineInterpolation": null,
"gridLineWidth": 1,
"gridLineColor": "#e6e6e6",
"min": 0,
"max": null,
"minorTickInterval": null,
"minorTickWidth": 0,
"minTickInterval": null,
"startOnTick": true,
"endOnTick": true,
"minRange": null,
"type": "linear",
"tickmarkPlacement": null,
"labels": {
"enabled": true,
"formatter": null,
"style": {
"color": "#666666",
"cursor": "default",
"fontSize": "11px"
},
"useHTML": false
}
},
"zAxis": {
"title": {
"text": "Multi Score"
}
},
"plotOptions": {
"series": {
"dataLabels": {
"enabled": false,
"format": null,
"distance": 30,
"align": "center",
"inside": null,
"allowOverlap": false,
"style": {
"fontSize": "11px"
}
},
"showInLegend": null,
"turboThreshold": 0,
"stacking": "",
"groupPadding": 0.2,
"centerInCategory": false,
"findNearestPointBy": "x"
}
},
"navigator": {
"enabled": false
},
"scrollbar": {
"enabled": false
},
"rangeSelector": {
"enabled": false,
"inputEnabled": false
},
"legend": {
"enabled": null,
"maxHeight": null,
"align": "center",
"verticalAlign": "bottom",
"layout": "horizontal",
"width": null,
"margin": 12,
"reversed": false
},
"series": [
{
"name": "m6a.2xlarge by Amazon Web Services",
"color": "#f7981d",
"data": [
{
"x": 1154.8032837266956,
"y": 5196.8703959842405
},
{
"x": 1099.7925922056495,
"y": 5055.974656142717
},
{
"x": 1158.0806173857384,
"y": 5256.924935445496
},
{
"x": 1109.890820529585,
"y": 5040.866925097433
},
{
"x": 1157.8377374848055,
"y": 5262.456751788962
},
{
"x": 1076.6873310063397,
"y": 5038.20351145574
},
{
"x": 1143.646474585023,
"y": 5243.755842598197
},
{
"x": 1108.0010588040773,
"y": 5012.848195833691
},
{
"x": 1156.901283549282,
"y": 5271.271475063731
},
{
"x": 1090.5748593460482,
"y": 5025.386904522704
},
{
"x": 1140.9025842107394,
"y": 5182.657546880605
},
{
"x": 1077.8120088569024,
"y": 5064.921002992762
},
{
"x": 1139.088802056732,
"y": 5251.117515474361
},
{
"x": 1100.6712697174048,
"y": 5137.179660828366
},
{
"x": 1138.2427090594297,
"y": 5238.882619434293
},
{
"x": 1111.445626232185,
"y": 5110.179706820179
},
{
"x": 1156.5048878108205,
"y": 5260.767532306129
},
{
"x": 1105.3885530559105,
"y": 5153.017293340574
},
{
"x": 1113.678117616,
"y": 5241.539227472975
},
{
"x": 1106.4726903587296,
"y": 5158.947677330381
},
{
"x": 1322.4887360585806,
"y": 5689.196225052063
},
{
"x": 1294.9567260966917,
"y": 5546.276133729646
},
{
"x": 1319.9036075826327,
"y": 5617.289239815488
},
{
"x": 1289.513913957875,
"y": 5585.130570936631
},
{
"x": 1301.8007311921106,
"y": 5629.4264617218
},
{
"x": 1292.5252595082957,
"y": 5540.966008582401
},
{
"x": 1304.5058431392752,
"y": 5654.834395267373
},
{
"x": 1289.492619677321,
"y": 5510.695000950265
},
{
"x": 1304.518728434847,
"y": 5590.139992012349
},
{
"x": 1289.300254611141,
"y": 5556.0736387934185
},
{
"x": 1296.6232345394124,
"y": 5602.360733085233
},
{
"x": 1287.7006091860007,
"y": 5563.4154658375
},
{
"x": 1275.2798728803375,
"y": 5570.2572723676285
},
{
"x": 1283.1373692197894,
"y": 5525.819863525716
},
{
"x": 1277.9818094813668,
"y": 5623.086357297461
},
{
"x": 1287.3562867069124,
"y": 5514.158816160747
},
{
"x": 1291.4138974386522,
"y": 5567.404892556791
},
{
"x": 1287.8364015791271,
"y": 5529.0899132253835
},
{
"x": 1301.548760287333,
"y": 5637.757604956425
},
{
"x": 1287.4214900210288,
"y": 5548.717799836216
},
{
"x": 1304.2326771561584,
"y": 5587.316272512504
},
{
"x": 1302.0313679390924,
"y": 5532.921921725136
},
{
"x": 1300.2683448403504,
"y": 5580.689296975883
},
{
"x": 1297.0931428871597,
"y": 5545.884182096196
},
{
"x": 1295.768945949612,
"y": 5612.091748685969
},
{
"x": 1298.2080120944088,
"y": 5572.971503697329
}
]
}
],
"drilldown": {},
"tooltip": {
"enabled": true,
"useHTML": false,
"format": null,
"headerFormat": "",
"pointFormat": "<span style=\"color:{series.color}\">Single</span>: <b>{point.x:.0f}</b><br><span style=\"color:{series.color}\">Multi</span>: <b>{point.y:.0f}</b>",
"footerFormat": "",
"shared": false,
"outside": false,
"valueDecimals": null,
"split": false
},
"annotations": null
},
"hc_type": "chart",
"id": "194180584557144222938625690061528395082"
}
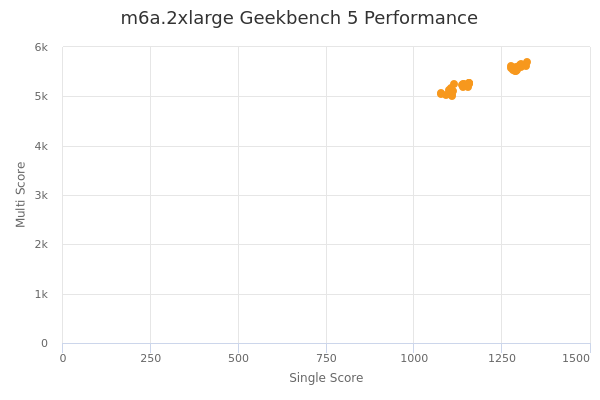
| Single | Multi | |
|---|---|---|
| Max | 1322 | 5689 |
| Average | 1220 | 5396 |
| Deviation | 88.02 | 218.23 |
| Min | 1077 | 5013 |
Sign up as Freemium to get more insight.