m6a.32xlarge by Amazon Web Services
Geekbench is a cross-platform processor benchmark with a scoring system that determines single-core and multi-core performance using loads simulating real-world scenarios. Geekbench 5 score is calculated with a reference score of 2500 representing the performance of the Intel Core i5-2520M @ 2.50 GHz. The software benchmark is available for Mac OS, Windows, Linux, Android and iOS platforms.
Specifications:
CPU
128
RAM
512.0 GB
Net
50000 Mbps
{
"configuration": {
"chart": {
"type": "scatter",
"polar": false,
"zoomType": "",
"options3d": {},
"height": null,
"width": null,
"margin": null,
"inverted": false,
"zooming": {}
},
"credits": {
"enabled": false
},
"title": {
"text": ""
},
"colorAxis": null,
"subtitle": {
"text": ""
},
"xAxis": {
"title": {
"text": [
"Single Score"
],
"useHTML": false,
"style": {
"color": "#666666"
}
},
"categories": null,
"lineWidth": 1,
"tickInterval": null,
"tickWidth": 1,
"tickLength": 10,
"tickPixelInterval": 100,
"plotLines": null,
"labels": {
"enabled": true,
"format": null,
"formatter": "",
"style": {
"color": "#666666",
"cursor": "default",
"fontSize": "11px"
},
"useHTML": false,
"step": 0
},
"plotBands": null,
"visible": true,
"floor": null,
"ceiling": null,
"type": "linear",
"min": 0,
"gridLineWidth": 1,
"gridLineColor": "#e6e6e6",
"minorTickInterval": null,
"minorTickWidth": 0,
"minTickInterval": null,
"startOnTick": true,
"endOnTick": true,
"tickmarkPlacement": 100,
"units": 100,
"minRange": 100
},
"yAxis": {
"title": {
"text": [
"Multi Score"
],
"useHTML": false,
"style": {
"color": "#666666"
}
},
"categories": null,
"plotLines": null,
"plotBands": null,
"lineWidth": null,
"tickInterval": null,
"tickLength": 10,
"floor": null,
"ceiling": null,
"gridLineInterpolation": null,
"gridLineWidth": 1,
"gridLineColor": "#e6e6e6",
"min": 0,
"max": null,
"minorTickInterval": null,
"minorTickWidth": 0,
"minTickInterval": null,
"startOnTick": true,
"endOnTick": true,
"minRange": null,
"type": "linear",
"tickmarkPlacement": null,
"labels": {
"enabled": true,
"formatter": null,
"style": {
"color": "#666666",
"cursor": "default",
"fontSize": "11px"
},
"useHTML": false
}
},
"zAxis": {
"title": {
"text": "Multi Score"
}
},
"plotOptions": {
"series": {
"dataLabels": {
"enabled": false,
"format": null,
"distance": 30,
"align": "center",
"inside": null,
"allowOverlap": false,
"style": {
"fontSize": "11px"
}
},
"showInLegend": null,
"turboThreshold": 0,
"stacking": "",
"groupPadding": 0.2,
"centerInCategory": false,
"findNearestPointBy": "x"
}
},
"navigator": {
"enabled": false
},
"scrollbar": {
"enabled": false
},
"rangeSelector": {
"enabled": false,
"inputEnabled": false
},
"legend": {
"enabled": null,
"maxHeight": null,
"align": "center",
"verticalAlign": "bottom",
"layout": "horizontal",
"width": null,
"margin": 12,
"reversed": false
},
"series": [
{
"name": "m6a.32xlarge by Amazon Web Services",
"color": "#f7981d",
"data": [
{
"x": 1315.3105076675356,
"y": 49974.748747572696
},
{
"x": 1311.7596323729927,
"y": 50509.7764900153
},
{
"x": 1303.3233763881644,
"y": 51138.49298603873
},
{
"x": 1301.0168366247076,
"y": 48631.99090615295
},
{
"x": 1304.6184174694622,
"y": 48572.68358894161
},
{
"x": 1302.139947473013,
"y": 51224.71305276186
},
{
"x": 1301.44935737727,
"y": 50711.54767813415
},
{
"x": 1298.8004810927039,
"y": 46416.86669541093
},
{
"x": 1304.8987893442418,
"y": 51547.96890394686
},
{
"x": 1294.554872127649,
"y": 46911.25071087472
},
{
"x": 1308.3268173185566,
"y": 49892.696708366806
},
{
"x": 1300.6325837732913,
"y": 47435.503526845074
},
{
"x": 1304.816179421984,
"y": 48494.81577840346
},
{
"x": 1296.0347163072554,
"y": 49093.38262444279
},
{
"x": 1303.1608259629181,
"y": 51747.292575629064
},
{
"x": 1304.87152218032,
"y": 48155.127517024026
},
{
"x": 1303.6055169057493,
"y": 49349.60131728754
},
{
"x": 1297.0615440324514,
"y": 47385.347711830065
},
{
"x": 1299.8586693104855,
"y": 48515.88098196816
},
{
"x": 1305.8465610050152,
"y": 49961.31708667234
}
]
}
],
"drilldown": {},
"tooltip": {
"enabled": true,
"useHTML": false,
"format": null,
"headerFormat": "",
"pointFormat": "<span style=\"color:{series.color}\">Single</span>: <b>{point.x:.0f}</b><br><span style=\"color:{series.color}\">Multi</span>: <b>{point.y:.0f}</b>",
"footerFormat": "",
"shared": false,
"outside": false,
"valueDecimals": null,
"split": false
},
"annotations": null
},
"hc_type": "chart",
"id": "205766340876074216346759312272746966848"
}
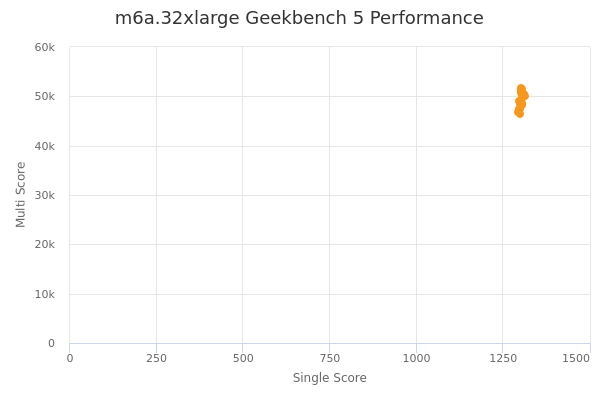
| Single | Multi | |
|---|---|---|
| Max | 1315 | 51747 |
| Average | 1303 | 49284 |
| Deviation | 4.86 | 1542.35 |
| Min | 1295 | 46417 |
Sign up as Freemium to get more insight.