m6a.large by Amazon Web Services
Geekbench is a cross-platform processor benchmark with a scoring system that determines single-core and multi-core performance using loads simulating real-world scenarios. Geekbench 5 score is calculated with a reference score of 2500 representing the performance of the Intel Core i5-2520M @ 2.50 GHz. The software benchmark is available for Mac OS, Windows, Linux, Android and iOS platforms.
Specifications:
CPU
2
RAM
8.0 GB
Net
12500 Mbps
{
"configuration": {
"chart": {
"type": "scatter",
"polar": false,
"zoomType": "",
"options3d": {},
"height": null,
"width": null,
"margin": null,
"inverted": false,
"zooming": {}
},
"credits": {
"enabled": false
},
"title": {
"text": ""
},
"colorAxis": null,
"subtitle": {
"text": ""
},
"xAxis": {
"title": {
"text": [
"Single Score"
],
"useHTML": false,
"style": {
"color": "#666666"
}
},
"categories": null,
"lineWidth": 1,
"tickInterval": null,
"tickWidth": 1,
"tickLength": 10,
"tickPixelInterval": 100,
"plotLines": null,
"labels": {
"enabled": true,
"format": null,
"formatter": "",
"style": {
"color": "#666666",
"cursor": "default",
"fontSize": "11px"
},
"useHTML": false,
"step": 0
},
"plotBands": null,
"visible": true,
"floor": null,
"ceiling": null,
"type": "linear",
"min": 0,
"gridLineWidth": 1,
"gridLineColor": "#e6e6e6",
"minorTickInterval": null,
"minorTickWidth": 0,
"minTickInterval": null,
"startOnTick": true,
"endOnTick": true,
"tickmarkPlacement": 100,
"units": 100,
"minRange": 100
},
"yAxis": {
"title": {
"text": [
"Multi Score"
],
"useHTML": false,
"style": {
"color": "#666666"
}
},
"categories": null,
"plotLines": null,
"plotBands": null,
"lineWidth": null,
"tickInterval": null,
"tickLength": 10,
"floor": null,
"ceiling": null,
"gridLineInterpolation": null,
"gridLineWidth": 1,
"gridLineColor": "#e6e6e6",
"min": 0,
"max": null,
"minorTickInterval": null,
"minorTickWidth": 0,
"minTickInterval": null,
"startOnTick": true,
"endOnTick": true,
"minRange": null,
"type": "linear",
"tickmarkPlacement": null,
"labels": {
"enabled": true,
"formatter": null,
"style": {
"color": "#666666",
"cursor": "default",
"fontSize": "11px"
},
"useHTML": false
}
},
"zAxis": {
"title": {
"text": "Multi Score"
}
},
"plotOptions": {
"series": {
"dataLabels": {
"enabled": false,
"format": null,
"distance": 30,
"align": "center",
"inside": null,
"allowOverlap": false,
"style": {
"fontSize": "11px"
}
},
"showInLegend": null,
"turboThreshold": 0,
"stacking": "",
"groupPadding": 0.2,
"centerInCategory": false,
"findNearestPointBy": "x"
}
},
"navigator": {
"enabled": false
},
"scrollbar": {
"enabled": false
},
"rangeSelector": {
"enabled": false,
"inputEnabled": false
},
"legend": {
"enabled": null,
"maxHeight": null,
"align": "center",
"verticalAlign": "bottom",
"layout": "horizontal",
"width": null,
"margin": 12,
"reversed": false
},
"series": [
{
"name": "m6a.large by Amazon Web Services",
"color": "#f7981d",
"data": [
{
"x": 1057.2459835174868,
"y": 1396.5662772108808
},
{
"x": 1091.9863099538095,
"y": 1431.215791264393
},
{
"x": 1070.9055441773558,
"y": 1414.0514978281817
},
{
"x": 1020.2663351390545,
"y": 1447.6550161762907
},
{
"x": 1057.51355073251,
"y": 1375.8332759976247
},
{
"x": 1086.0413249781286,
"y": 1431.2203563529604
},
{
"x": 1084.6792404438104,
"y": 1373.456452466774
},
{
"x": 1053.4771736666034,
"y": 1376.742776998619
},
{
"x": 1023.8397980162877,
"y": 1463.9982869891264
},
{
"x": 1069.9385546739784,
"y": 1364.3592720658858
},
{
"x": 1113.1002384340113,
"y": 1468.0148903419454
},
{
"x": 1056.5312961659793,
"y": 1408.5731245467164
},
{
"x": 1119.649125443387,
"y": 1490.4379330221736
},
{
"x": 1095.8389807312728,
"y": 1421.0949389277077
},
{
"x": 1113.2936150119658,
"y": 1463.8656864794593
},
{
"x": 1080.0224497651636,
"y": 1436.4895986286242
},
{
"x": 1105.2106238501524,
"y": 1488.7094027254643
},
{
"x": 1052.5827038910782,
"y": 1392.396586031953
},
{
"x": 1116.249502412888,
"y": 1491.3926669408975
},
{
"x": 1081.2410470469881,
"y": 1420.2182610272537
}
]
}
],
"drilldown": {},
"tooltip": {
"enabled": true,
"useHTML": false,
"format": null,
"headerFormat": "",
"pointFormat": "<span style=\"color:{series.color}\">Single</span>: <b>{point.x:.0f}</b><br><span style=\"color:{series.color}\">Multi</span>: <b>{point.y:.0f}</b>",
"footerFormat": "",
"shared": false,
"outside": false,
"valueDecimals": null,
"split": false
},
"annotations": null
},
"hc_type": "chart",
"id": "235450530493269413455529393638628620703"
}
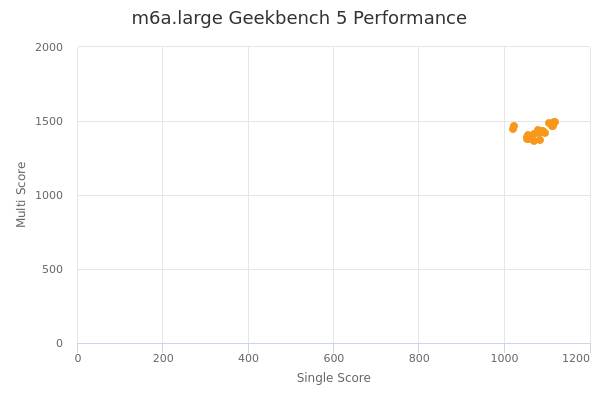
| Single | Multi | |
|---|---|---|
| Max | 1120 | 1491 |
| Average | 1077 | 1428 |
| Deviation | 28.27 | 39.73 |
| Min | 1020 | 1364 |
Sign up as Freemium to get more insight.