m6a.4xlarge by Amazon Web Services
Geekbench is a cross-platform processor benchmark with a scoring system that determines single-core and multi-core performance using loads simulating real-world scenarios. Geekbench 5 score is calculated with a reference score of 2500 representing the performance of the Intel Core i5-2520M @ 2.50 GHz. The software benchmark is available for Mac OS, Windows, Linux, Android and iOS platforms.
Specifications:
CPU
16
RAM
64.0 GB
Net
12500 Mbps
{
"configuration": {
"chart": {
"type": "scatter",
"polar": false,
"zoomType": "",
"options3d": {},
"height": null,
"width": null,
"margin": null,
"inverted": false,
"zooming": {}
},
"credits": {
"enabled": false
},
"title": {
"text": ""
},
"colorAxis": null,
"subtitle": {
"text": ""
},
"xAxis": {
"title": {
"text": [
"Single Score"
],
"useHTML": false,
"style": {
"color": "#666666"
}
},
"categories": null,
"lineWidth": 1,
"tickInterval": null,
"tickWidth": 1,
"tickLength": 10,
"tickPixelInterval": 100,
"plotLines": null,
"labels": {
"enabled": true,
"format": null,
"formatter": "",
"style": {
"color": "#666666",
"cursor": "default",
"fontSize": "11px"
},
"useHTML": false,
"step": 0
},
"plotBands": null,
"visible": true,
"floor": null,
"ceiling": null,
"type": "linear",
"min": 0,
"gridLineWidth": 1,
"gridLineColor": "#e6e6e6",
"minorTickInterval": null,
"minorTickWidth": 0,
"minTickInterval": null,
"startOnTick": true,
"endOnTick": true,
"tickmarkPlacement": 100,
"units": 100,
"minRange": 100
},
"yAxis": {
"title": {
"text": [
"Multi Score"
],
"useHTML": false,
"style": {
"color": "#666666"
}
},
"categories": null,
"plotLines": null,
"plotBands": null,
"lineWidth": null,
"tickInterval": null,
"tickLength": 10,
"floor": null,
"ceiling": null,
"gridLineInterpolation": null,
"gridLineWidth": 1,
"gridLineColor": "#e6e6e6",
"min": 0,
"max": null,
"minorTickInterval": null,
"minorTickWidth": 0,
"minTickInterval": null,
"startOnTick": true,
"endOnTick": true,
"minRange": null,
"type": "linear",
"tickmarkPlacement": null,
"labels": {
"enabled": true,
"formatter": null,
"style": {
"color": "#666666",
"cursor": "default",
"fontSize": "11px"
},
"useHTML": false
}
},
"zAxis": {
"title": {
"text": "Multi Score"
}
},
"plotOptions": {
"series": {
"dataLabels": {
"enabled": false,
"format": null,
"distance": 30,
"align": "center",
"inside": null,
"allowOverlap": false,
"style": {
"fontSize": "11px"
}
},
"showInLegend": null,
"turboThreshold": 0,
"stacking": "",
"groupPadding": 0.2,
"centerInCategory": false,
"findNearestPointBy": "x"
}
},
"navigator": {
"enabled": false
},
"scrollbar": {
"enabled": false
},
"rangeSelector": {
"enabled": false,
"inputEnabled": false
},
"legend": {
"enabled": null,
"maxHeight": null,
"align": "center",
"verticalAlign": "bottom",
"layout": "horizontal",
"width": null,
"margin": 12,
"reversed": false
},
"series": [
{
"name": "m6a.4xlarge by Amazon Web Services",
"color": "#f7981d",
"data": [
{
"x": 1120.8573925023195,
"y": 8943.252384855787
},
{
"x": 1139.5384082449566,
"y": 8682.294424480206
},
{
"x": 1085.5925326852391,
"y": 8921.971043985304
},
{
"x": 1080.695664592614,
"y": 8873.963216277109
},
{
"x": 1140.909881083142,
"y": 8945.212290825904
},
{
"x": 1117.877777487473,
"y": 8669.026674967381
},
{
"x": 1063.2761978240487,
"y": 8917.887523976147
},
{
"x": 1069.104227700133,
"y": 8928.456633415517
},
{
"x": 1101.116910914524,
"y": 8980.095839097487
},
{
"x": 1053.885436044624,
"y": 8746.083823013416
},
{
"x": 1145.818395973081,
"y": 8930.641642959868
},
{
"x": 1070.216756638301,
"y": 8746.083119946667
},
{
"x": 1087.9008009791914,
"y": 8980.05400575852
},
{
"x": 1084.504282517224,
"y": 8828.825840457399
},
{
"x": 1113.1518209329117,
"y": 8959.333325383075
},
{
"x": 1067.9340552004019,
"y": 8500.492782213318
},
{
"x": 1115.3994605615942,
"y": 8920.264344183812
},
{
"x": 1095.23890528125,
"y": 8563.974760786905
},
{
"x": 1111.231589948584,
"y": 8947.850565073753
},
{
"x": 1073.467555013631,
"y": 8557.45209534647
}
]
}
],
"drilldown": {},
"tooltip": {
"enabled": true,
"useHTML": false,
"format": null,
"headerFormat": "",
"pointFormat": "<span style=\"color:{series.color}\">Single</span>: <b>{point.x:.0f}</b><br><span style=\"color:{series.color}\">Multi</span>: <b>{point.y:.0f}</b>",
"footerFormat": "",
"shared": false,
"outside": false,
"valueDecimals": null,
"split": false
},
"annotations": null
},
"hc_type": "chart",
"id": "283350616587445654858803737000515029785"
}
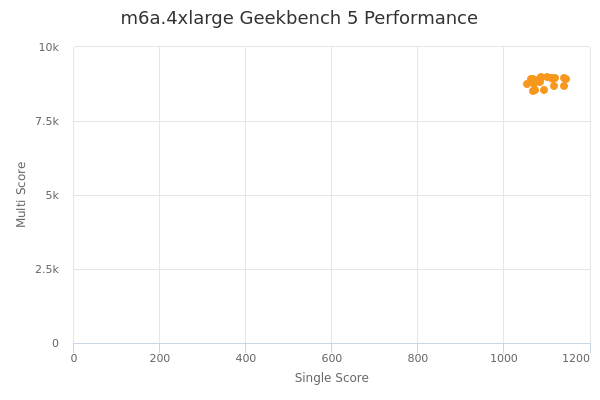
| Single | Multi | |
|---|---|---|
| Max | 1146 | 8980 |
| Average | 1097 | 8827 |
| Deviation | 26.90 | 152.17 |
| Min | 1054 | 8500 |
Sign up as Freemium to get more insight.