m6a.48xlarge by Amazon Web Services
Geekbench is a cross-platform processor benchmark with a scoring system that determines single-core and multi-core performance using loads simulating real-world scenarios. Geekbench 5 score is calculated with a reference score of 2500 representing the performance of the Intel Core i5-2520M @ 2.50 GHz. The software benchmark is available for Mac OS, Windows, Linux, Android and iOS platforms.
Specifications:
CPU
192
RAM
768.0 GB
Net
50000 Mbps
{
"configuration": {
"chart": {
"type": "scatter",
"polar": false,
"zoomType": "",
"options3d": {},
"height": null,
"width": null,
"margin": null,
"inverted": false,
"zooming": {}
},
"credits": {
"enabled": false
},
"title": {
"text": ""
},
"colorAxis": null,
"subtitle": {
"text": ""
},
"xAxis": {
"title": {
"text": [
"Single Score"
],
"useHTML": false,
"style": {
"color": "#666666"
}
},
"categories": null,
"lineWidth": 1,
"tickInterval": null,
"tickWidth": 1,
"tickLength": 10,
"tickPixelInterval": 100,
"plotLines": null,
"labels": {
"enabled": true,
"format": null,
"formatter": "",
"style": {
"color": "#666666",
"cursor": "default",
"fontSize": "11px"
},
"useHTML": false,
"step": 0
},
"plotBands": null,
"visible": true,
"floor": null,
"ceiling": null,
"type": "linear",
"min": 0,
"gridLineWidth": 1,
"gridLineColor": "#e6e6e6",
"minorTickInterval": null,
"minorTickWidth": 0,
"minTickInterval": null,
"startOnTick": true,
"endOnTick": true,
"tickmarkPlacement": 100,
"units": 100,
"minRange": 100
},
"yAxis": {
"title": {
"text": [
"Multi Score"
],
"useHTML": false,
"style": {
"color": "#666666"
}
},
"categories": null,
"plotLines": null,
"plotBands": null,
"lineWidth": null,
"tickInterval": null,
"tickLength": 10,
"floor": null,
"ceiling": null,
"gridLineInterpolation": null,
"gridLineWidth": 1,
"gridLineColor": "#e6e6e6",
"min": 0,
"max": null,
"minorTickInterval": null,
"minorTickWidth": 0,
"minTickInterval": null,
"startOnTick": true,
"endOnTick": true,
"minRange": null,
"type": "linear",
"tickmarkPlacement": null,
"labels": {
"enabled": true,
"formatter": null,
"style": {
"color": "#666666",
"cursor": "default",
"fontSize": "11px"
},
"useHTML": false
}
},
"zAxis": {
"title": {
"text": "Multi Score"
}
},
"plotOptions": {
"series": {
"dataLabels": {
"enabled": false,
"format": null,
"distance": 30,
"align": "center",
"inside": null,
"allowOverlap": false,
"style": {
"fontSize": "11px"
}
},
"showInLegend": null,
"turboThreshold": 0,
"stacking": "",
"groupPadding": 0.2,
"centerInCategory": false,
"findNearestPointBy": "x"
}
},
"navigator": {
"enabled": false
},
"scrollbar": {
"enabled": false
},
"rangeSelector": {
"enabled": false,
"inputEnabled": false
},
"legend": {
"enabled": null,
"maxHeight": null,
"align": "center",
"verticalAlign": "bottom",
"layout": "horizontal",
"width": null,
"margin": 12,
"reversed": false
},
"series": [
{
"name": "m6a.48xlarge by Amazon Web Services",
"color": "#f7981d",
"data": [
{
"x": 1315.2190135387686,
"y": 59985.86729451228
},
{
"x": 1310.178907695701,
"y": 60660.11661841116
},
{
"x": 1301.5932323478248,
"y": 59824.00405566505
},
{
"x": 1297.347889851613,
"y": 59758.579400481096
},
{
"x": 1302.3086102224115,
"y": 63478.47510956081
},
{
"x": 1303.545530104383,
"y": 59487.37023958815
},
{
"x": 1308.5002202669211,
"y": 58876.58570701493
},
{
"x": 1298.2729326461056,
"y": 57139.4844877342
},
{
"x": 1302.0423432693178,
"y": 59241.50009209477
},
{
"x": 1300.103860601314,
"y": 60492.02877515124
},
{
"x": 1303.0406382811793,
"y": 58596.915547158234
},
{
"x": 1303.7956858201237,
"y": 60716.275675106954
},
{
"x": 1300.2522212869771,
"y": 59750.52484128342
},
{
"x": 1298.9868251309026,
"y": 58819.85547313661
},
{
"x": 1300.658878427183,
"y": 59489.456512669174
},
{
"x": 1305.294770829466,
"y": 60347.326689053276
},
{
"x": 1300.3786739036198,
"y": 61861.3143976806
},
{
"x": 1303.6812751237771,
"y": 57731.92283702243
},
{
"x": 1304.066978828511,
"y": 58251.203689274465
},
{
"x": 1301.231970112749,
"y": 60130.08042282521
}
]
}
],
"drilldown": {},
"tooltip": {
"enabled": true,
"useHTML": false,
"format": null,
"headerFormat": "",
"pointFormat": "<span style=\"color:{series.color}\">Single</span>: <b>{point.x:.0f}</b><br><span style=\"color:{series.color}\">Multi</span>: <b>{point.y:.0f}</b>",
"footerFormat": "",
"shared": false,
"outside": false,
"valueDecimals": null,
"split": false
},
"annotations": null
},
"hc_type": "chart",
"id": "59529210774595062713397925548544455215"
}
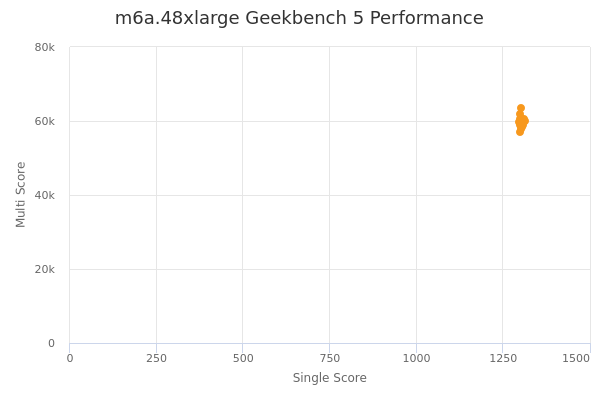
| Single | Multi | |
|---|---|---|
| Max | 1315 | 63478 |
| Average | 1303 | 59732 |
| Deviation | 4.15 | 1373.22 |
| Min | 1297 | 57139 |
Sign up as Freemium to get more insight.