i4i.large by Amazon Web Services
Geekbench is a cross-platform processor benchmark with a scoring system that determines single-core and multi-core performance using loads simulating real-world scenarios. Geekbench 5 score is calculated with a reference score of 2500 representing the performance of the Intel Core i5-2520M @ 2.50 GHz. The software benchmark is available for Mac OS, Windows, Linux, Android and iOS platforms.
Specifications:
CPU
2
RAM
16.0 GB
Extra
1x
468 GB
NVMe SSD
Net
10000 Mbps
{
"configuration": {
"chart": {
"type": "scatter",
"polar": false,
"zoomType": "",
"options3d": {},
"height": null,
"width": null,
"margin": null,
"inverted": false,
"zooming": {}
},
"credits": {
"enabled": false
},
"title": {
"text": ""
},
"colorAxis": null,
"subtitle": {
"text": ""
},
"xAxis": {
"title": {
"text": [
"Single Score"
],
"useHTML": false,
"style": {
"color": "#666666"
}
},
"categories": null,
"lineWidth": 1,
"tickInterval": null,
"tickWidth": 1,
"tickLength": 10,
"tickPixelInterval": 100,
"plotLines": null,
"labels": {
"enabled": true,
"format": null,
"formatter": "",
"style": {
"color": "#666666",
"cursor": "default",
"fontSize": "11px"
},
"useHTML": false,
"step": 0
},
"plotBands": null,
"visible": true,
"floor": null,
"ceiling": null,
"type": "linear",
"min": 0,
"gridLineWidth": 1,
"gridLineColor": "#e6e6e6",
"minorTickInterval": null,
"minorTickWidth": 0,
"minTickInterval": null,
"startOnTick": true,
"endOnTick": true,
"tickmarkPlacement": 100,
"units": 100,
"minRange": 100
},
"yAxis": {
"title": {
"text": [
"Multi Score"
],
"useHTML": false,
"style": {
"color": "#666666"
}
},
"categories": null,
"plotLines": null,
"plotBands": null,
"lineWidth": null,
"tickInterval": null,
"tickLength": 10,
"floor": null,
"ceiling": null,
"gridLineInterpolation": null,
"gridLineWidth": 1,
"gridLineColor": "#e6e6e6",
"min": 0,
"max": null,
"minorTickInterval": null,
"minorTickWidth": 0,
"minTickInterval": null,
"startOnTick": true,
"endOnTick": true,
"minRange": null,
"type": "linear",
"tickmarkPlacement": null,
"labels": {
"enabled": true,
"formatter": null,
"style": {
"color": "#666666",
"cursor": "default",
"fontSize": "11px"
},
"useHTML": false
}
},
"zAxis": {
"title": {
"text": "Multi Score"
}
},
"plotOptions": {
"series": {
"dataLabels": {
"enabled": false,
"format": null,
"distance": 30,
"align": "center",
"inside": null,
"allowOverlap": false,
"style": {
"fontSize": "11px"
}
},
"showInLegend": null,
"turboThreshold": 0,
"stacking": "",
"groupPadding": 0.2,
"centerInCategory": false,
"findNearestPointBy": "x"
}
},
"navigator": {
"enabled": false
},
"scrollbar": {
"enabled": false
},
"rangeSelector": {
"enabled": false,
"inputEnabled": false
},
"legend": {
"enabled": null,
"maxHeight": null,
"align": "center",
"verticalAlign": "bottom",
"layout": "horizontal",
"width": null,
"margin": 12,
"reversed": false
},
"series": [
{
"name": "i4i.large by Amazon Web Services",
"color": "#f7981d",
"data": [
{
"x": 1234.338633510793,
"y": 1433.800201623086
},
{
"x": 1216.8212369068488,
"y": 1420.2826154476627
},
{
"x": 1243.1581233560164,
"y": 1435.329647158622
},
{
"x": 1220.3255747614971,
"y": 1401.9515067086095
},
{
"x": 1245.6141999065965,
"y": 1444.4557002080385
},
{
"x": 1220.338802765618,
"y": 1424.0339846052184
},
{
"x": 1252.632034696155,
"y": 1437.2838415934834
},
{
"x": 1229.6636329828757,
"y": 1426.1931054094987
},
{
"x": 1249.99747445341,
"y": 1433.2560985577188
},
{
"x": 1226.4086631372932,
"y": 1424.3300305002163
},
{
"x": 1247.455842407479,
"y": 1435.5598995739915
},
{
"x": 1218.4930471510474,
"y": 1418.0570408427864
},
{
"x": 1237.930848979031,
"y": 1427.8197549731722
},
{
"x": 1205.8274001136558,
"y": 1415.787341958829
},
{
"x": 1245.4846966384303,
"y": 1433.1553704793173
},
{
"x": 1217.3206413666542,
"y": 1411.6212433909934
},
{
"x": 1241.586889936574,
"y": 1439.1980905102955
},
{
"x": 1213.874265946568,
"y": 1422.2988926518312
},
{
"x": 1255.06756055714,
"y": 1441.9412426224553
},
{
"x": 1223.771734813538,
"y": 1426.6240557840702
}
]
}
],
"drilldown": {},
"tooltip": {
"enabled": true,
"useHTML": false,
"format": null,
"headerFormat": "",
"pointFormat": "<span style=\"color:{series.color}\">Single</span>: <b>{point.x:.0f}</b><br><span style=\"color:{series.color}\">Multi</span>: <b>{point.y:.0f}</b>",
"footerFormat": "",
"shared": false,
"outside": false,
"valueDecimals": null,
"split": false
},
"annotations": null
},
"hc_type": "chart",
"id": "782553028072848163408851696492272191"
}
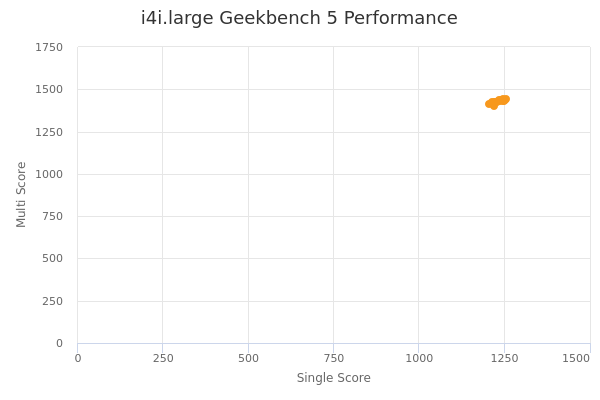
| Single | Multi | |
|---|---|---|
| Max | 1255 | 1444 |
| Average | 1232 | 1428 |
| Deviation | 14.42 | 10.47 |
| Min | 1206 | 1402 |
Sign up as Freemium to get more insight.