i4i.32xlarge by Amazon Web Services
Geekbench is a cross-platform processor benchmark with a scoring system that determines single-core and multi-core performance using loads simulating real-world scenarios. Geekbench 5 score is calculated with a reference score of 2500 representing the performance of the Intel Core i5-2520M @ 2.50 GHz. The software benchmark is available for Mac OS, Windows, Linux, Android and iOS platforms.
Specifications:
CPU
128
RAM
1024.0 GB
Extra
8x
3750 GB
SSD
Net
75000 Mbps
{
"configuration": {
"chart": {
"type": "scatter",
"polar": false,
"zoomType": "",
"options3d": {},
"height": null,
"width": null,
"margin": null,
"inverted": false,
"zooming": {}
},
"credits": {
"enabled": false
},
"title": {
"text": ""
},
"colorAxis": null,
"subtitle": {
"text": ""
},
"xAxis": {
"title": {
"text": [
"Single Score"
],
"useHTML": false,
"style": {
"color": "#666666"
}
},
"categories": null,
"lineWidth": 1,
"tickInterval": null,
"tickWidth": 1,
"tickLength": 10,
"tickPixelInterval": 100,
"plotLines": null,
"labels": {
"enabled": true,
"format": null,
"formatter": "",
"style": {
"color": "#666666",
"cursor": "default",
"fontSize": "11px"
},
"useHTML": false,
"step": 0
},
"plotBands": null,
"visible": true,
"floor": null,
"ceiling": null,
"type": "linear",
"min": 0,
"gridLineWidth": 1,
"gridLineColor": "#e6e6e6",
"minorTickInterval": null,
"minorTickWidth": 0,
"minTickInterval": null,
"startOnTick": true,
"endOnTick": true,
"tickmarkPlacement": 100,
"units": 100,
"minRange": 100
},
"yAxis": {
"title": {
"text": [
"Multi Score"
],
"useHTML": false,
"style": {
"color": "#666666"
}
},
"categories": null,
"plotLines": null,
"plotBands": null,
"lineWidth": null,
"tickInterval": null,
"tickLength": 10,
"floor": null,
"ceiling": null,
"gridLineInterpolation": null,
"gridLineWidth": 1,
"gridLineColor": "#e6e6e6",
"min": 0,
"max": null,
"minorTickInterval": null,
"minorTickWidth": 0,
"minTickInterval": null,
"startOnTick": true,
"endOnTick": true,
"minRange": null,
"type": "linear",
"tickmarkPlacement": null,
"labels": {
"enabled": true,
"formatter": null,
"style": {
"color": "#666666",
"cursor": "default",
"fontSize": "11px"
},
"useHTML": false
}
},
"zAxis": {
"title": {
"text": "Multi Score"
}
},
"plotOptions": {
"series": {
"dataLabels": {
"enabled": false,
"format": null,
"distance": 30,
"align": "center",
"inside": null,
"allowOverlap": false,
"style": {
"fontSize": "11px"
}
},
"showInLegend": null,
"turboThreshold": 0,
"stacking": "",
"groupPadding": 0.2,
"centerInCategory": false,
"findNearestPointBy": "x"
}
},
"navigator": {
"enabled": false
},
"scrollbar": {
"enabled": false
},
"rangeSelector": {
"enabled": false,
"inputEnabled": false
},
"legend": {
"enabled": null,
"maxHeight": null,
"align": "center",
"verticalAlign": "bottom",
"layout": "horizontal",
"width": null,
"margin": 12,
"reversed": false
},
"series": [
{
"name": "i4i.32xlarge by Amazon Web Services",
"color": "#f7981d",
"data": [
{
"x": 1252.605671906546,
"y": 51776.76191349646
},
{
"x": 1249.8796545036382,
"y": 53887.97409751204
},
{
"x": 1248.0570322654087,
"y": 51406.29204971618
},
{
"x": 1242.7853117728637,
"y": 52433.258128431546
},
{
"x": 1248.7021492706115,
"y": 51838.769899906285
},
{
"x": 1241.6028699956414,
"y": 51121.50768011672
},
{
"x": 1248.6497793748167,
"y": 52265.32336070696
},
{
"x": 1242.18717506392,
"y": 51090.52101396717
},
{
"x": 1258.355064149192,
"y": 53325.60776216558
},
{
"x": 1247.6608970377997,
"y": 51697.99438928809
},
{
"x": 1257.701528017163,
"y": 52479.917394116375
},
{
"x": 1247.7739057257595,
"y": 52178.73504488204
},
{
"x": 1255.1856602151627,
"y": 53028.099983124324
},
{
"x": 1256.7984136319092,
"y": 53172.515734809145
},
{
"x": 1247.8149245113943,
"y": 51773.72021228871
},
{
"x": 1258.3264942790672,
"y": 52758.093780334195
},
{
"x": 1247.7247852642117,
"y": 51875.2422401803
},
{
"x": 1257.359907321926,
"y": 51908.938786469436
},
{
"x": 1246.8045994238287,
"y": 51397.502295464874
},
{
"x": 1257.9157242736205,
"y": 51965.92570882352
}
]
}
],
"drilldown": {},
"tooltip": {
"enabled": true,
"useHTML": false,
"format": null,
"headerFormat": "",
"pointFormat": "<span style=\"color:{series.color}\">Single</span>: <b>{point.x:.0f}</b><br><span style=\"color:{series.color}\">Multi</span>: <b>{point.y:.0f}</b>",
"footerFormat": "",
"shared": false,
"outside": false,
"valueDecimals": null,
"split": false
},
"annotations": null
},
"hc_type": "chart",
"id": "42136032378855713631661175085223698956"
}
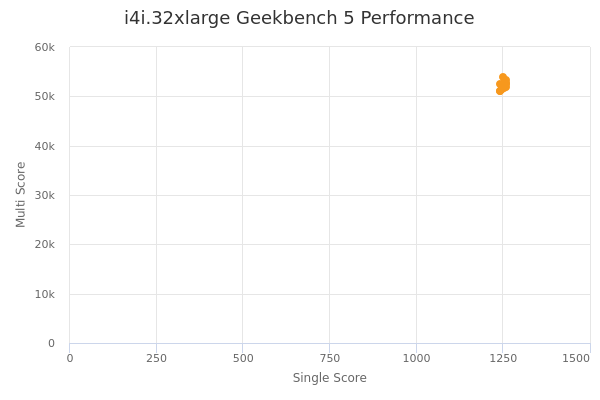
| Single | Multi | |
|---|---|---|
| Max | 1258 | 53888 |
| Average | 1251 | 52169 |
| Deviation | 5.51 | 736.00 |
| Min | 1242 | 51091 |
Sign up as Freemium to get more insight.