i4i.2xlarge by Amazon Web Services
Geekbench is a cross-platform processor benchmark with a scoring system that determines single-core and multi-core performance using loads simulating real-world scenarios. Geekbench 5 score is calculated with a reference score of 2500 representing the performance of the Intel Core i5-2520M @ 2.50 GHz. The software benchmark is available for Mac OS, Windows, Linux, Android and iOS platforms.
Specifications:
CPU
8
RAM
64.0 GB
Extra
1x
1875 GB
NVMe SSD
Net
12000 Mbps
{
"configuration": {
"chart": {
"type": "scatter",
"polar": false,
"zoomType": "",
"options3d": {},
"height": null,
"width": null,
"margin": null,
"inverted": false,
"zooming": {}
},
"credits": {
"enabled": false
},
"title": {
"text": ""
},
"colorAxis": null,
"subtitle": {
"text": ""
},
"xAxis": {
"title": {
"text": [
"Single Score"
],
"useHTML": false,
"style": {
"color": "#666666"
}
},
"categories": null,
"lineWidth": 1,
"tickInterval": null,
"tickWidth": 1,
"tickLength": 10,
"tickPixelInterval": 100,
"plotLines": null,
"labels": {
"enabled": true,
"format": null,
"formatter": "",
"style": {
"color": "#666666",
"cursor": "default",
"fontSize": "11px"
},
"useHTML": false,
"step": 0
},
"plotBands": null,
"visible": true,
"floor": null,
"ceiling": null,
"type": "linear",
"min": 0,
"gridLineWidth": 1,
"gridLineColor": "#e6e6e6",
"minorTickInterval": null,
"minorTickWidth": 0,
"minTickInterval": null,
"startOnTick": true,
"endOnTick": true,
"tickmarkPlacement": 100,
"units": 100,
"minRange": 100
},
"yAxis": {
"title": {
"text": [
"Multi Score"
],
"useHTML": false,
"style": {
"color": "#666666"
}
},
"categories": null,
"plotLines": null,
"plotBands": null,
"lineWidth": null,
"tickInterval": null,
"tickLength": 10,
"floor": null,
"ceiling": null,
"gridLineInterpolation": null,
"gridLineWidth": 1,
"gridLineColor": "#e6e6e6",
"min": 0,
"max": null,
"minorTickInterval": null,
"minorTickWidth": 0,
"minTickInterval": null,
"startOnTick": true,
"endOnTick": true,
"minRange": null,
"type": "linear",
"tickmarkPlacement": null,
"labels": {
"enabled": true,
"formatter": null,
"style": {
"color": "#666666",
"cursor": "default",
"fontSize": "11px"
},
"useHTML": false
}
},
"zAxis": {
"title": {
"text": "Multi Score"
}
},
"plotOptions": {
"series": {
"dataLabels": {
"enabled": false,
"format": null,
"distance": 30,
"align": "center",
"inside": null,
"allowOverlap": false,
"style": {
"fontSize": "11px"
}
},
"showInLegend": null,
"turboThreshold": 0,
"stacking": "",
"groupPadding": 0.2,
"centerInCategory": false,
"findNearestPointBy": "x"
}
},
"navigator": {
"enabled": false
},
"scrollbar": {
"enabled": false
},
"rangeSelector": {
"enabled": false,
"inputEnabled": false
},
"legend": {
"enabled": null,
"maxHeight": null,
"align": "center",
"verticalAlign": "bottom",
"layout": "horizontal",
"width": null,
"margin": 12,
"reversed": false
},
"series": [
{
"name": "i4i.2xlarge by Amazon Web Services",
"color": "#f7981d",
"data": [
{
"x": 1208.2434465668732,
"y": 5369.468538995686
},
{
"x": 1210.3337156930604,
"y": 5309.42654552843
},
{
"x": 1208.2216086963374,
"y": 5323.862005868901
},
{
"x": 1193.6574948291263,
"y": 5323.748726317422
},
{
"x": 1198.9892452159634,
"y": 5337.939336131592
},
{
"x": 1204.072983340468,
"y": 5277.259149156782
},
{
"x": 1221.1630686812866,
"y": 5310.0797084123205
},
{
"x": 1195.8765287068086,
"y": 5297.651842967618
},
{
"x": 1201.7083353757084,
"y": 5302.476806582291
},
{
"x": 1204.3233977916414,
"y": 5328.2219724862625
},
{
"x": 1205.0787723914318,
"y": 5292.781143061349
},
{
"x": 1206.1950055610712,
"y": 5329.097806633496
},
{
"x": 1201.5450285352101,
"y": 5332.567834455677
},
{
"x": 1201.901468270828,
"y": 5320.686495527445
},
{
"x": 1210.1007526721282,
"y": 5358.669050408955
},
{
"x": 1196.1051389235022,
"y": 5309.652382264124
},
{
"x": 1198.3834398724812,
"y": 5291.787583665163
},
{
"x": 1196.1282912475904,
"y": 5311.398952751045
},
{
"x": 1192.4198538736978,
"y": 5317.751278746024
},
{
"x": 1213.4080102021608,
"y": 5353.986051676617
}
]
}
],
"drilldown": {},
"tooltip": {
"enabled": true,
"useHTML": false,
"format": null,
"headerFormat": "",
"pointFormat": "<span style=\"color:{series.color}\">Single</span>: <b>{point.x:.0f}</b><br><span style=\"color:{series.color}\">Multi</span>: <b>{point.y:.0f}</b>",
"footerFormat": "",
"shared": false,
"outside": false,
"valueDecimals": null,
"split": false
},
"annotations": null
},
"hc_type": "chart",
"id": "101744458474702034634103964343076759243"
}
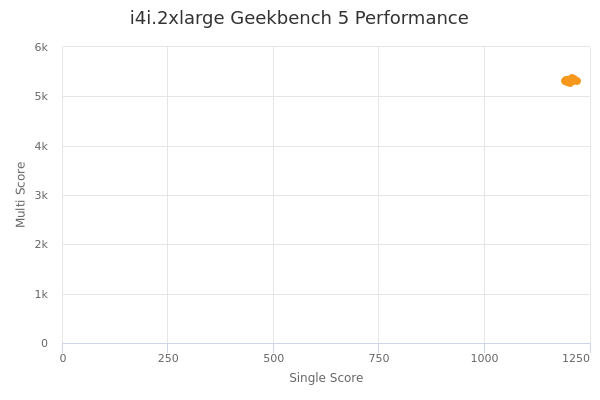
| Single | Multi | |
|---|---|---|
| Max | 1221 | 5369 |
| Average | 1203 | 5320 |
| Deviation | 7.07 | 22.72 |
| Min | 1192 | 5277 |
Sign up as Freemium to get more insight.