i4i.4xlarge by Amazon Web Services
Geekbench is a cross-platform processor benchmark with a scoring system that determines single-core and multi-core performance using loads simulating real-world scenarios. Geekbench 5 score is calculated with a reference score of 2500 representing the performance of the Intel Core i5-2520M @ 2.50 GHz. The software benchmark is available for Mac OS, Windows, Linux, Android and iOS platforms.
Specifications:
CPU
16
RAM
128.0 GB
Extra
1x
3750 GB
NVMe SSD
Net
25000 Mbps
{
"configuration": {
"chart": {
"type": "scatter",
"polar": false,
"zoomType": "",
"options3d": {},
"height": null,
"width": null,
"margin": null,
"inverted": false,
"zooming": {}
},
"credits": {
"enabled": false
},
"title": {
"text": ""
},
"colorAxis": null,
"subtitle": {
"text": ""
},
"xAxis": {
"title": {
"text": [
"Single Score"
],
"useHTML": false,
"style": {
"color": "#666666"
}
},
"categories": null,
"lineWidth": 1,
"tickInterval": null,
"tickWidth": 1,
"tickLength": 10,
"tickPixelInterval": 100,
"plotLines": null,
"labels": {
"enabled": true,
"format": null,
"formatter": "",
"style": {
"color": "#666666",
"cursor": "default",
"fontSize": "11px"
},
"useHTML": false,
"step": 0
},
"plotBands": null,
"visible": true,
"floor": null,
"ceiling": null,
"type": "linear",
"min": 0,
"gridLineWidth": 1,
"gridLineColor": "#e6e6e6",
"minorTickInterval": null,
"minorTickWidth": 0,
"minTickInterval": null,
"startOnTick": true,
"endOnTick": true,
"tickmarkPlacement": 100,
"units": 100,
"minRange": 100
},
"yAxis": {
"title": {
"text": [
"Multi Score"
],
"useHTML": false,
"style": {
"color": "#666666"
}
},
"categories": null,
"plotLines": null,
"plotBands": null,
"lineWidth": null,
"tickInterval": null,
"tickLength": 10,
"floor": null,
"ceiling": null,
"gridLineInterpolation": null,
"gridLineWidth": 1,
"gridLineColor": "#e6e6e6",
"min": 0,
"max": null,
"minorTickInterval": null,
"minorTickWidth": 0,
"minTickInterval": null,
"startOnTick": true,
"endOnTick": true,
"minRange": null,
"type": "linear",
"tickmarkPlacement": null,
"labels": {
"enabled": true,
"formatter": null,
"style": {
"color": "#666666",
"cursor": "default",
"fontSize": "11px"
},
"useHTML": false
}
},
"zAxis": {
"title": {
"text": "Multi Score"
}
},
"plotOptions": {
"series": {
"dataLabels": {
"enabled": false,
"format": null,
"distance": 30,
"align": "center",
"inside": null,
"allowOverlap": false,
"style": {
"fontSize": "11px"
}
},
"showInLegend": null,
"turboThreshold": 0,
"stacking": "",
"groupPadding": 0.2,
"centerInCategory": false,
"findNearestPointBy": "x"
}
},
"navigator": {
"enabled": false
},
"scrollbar": {
"enabled": false
},
"rangeSelector": {
"enabled": false,
"inputEnabled": false
},
"legend": {
"enabled": null,
"maxHeight": null,
"align": "center",
"verticalAlign": "bottom",
"layout": "horizontal",
"width": null,
"margin": 12,
"reversed": false
},
"series": [
{
"name": "i4i.4xlarge by Amazon Web Services",
"color": "#f7981d",
"data": [
{
"x": 1253.291736601252,
"y": 10235.84908235312
},
{
"x": 1209.2758088003754,
"y": 10045.483525765885
},
{
"x": 1273.5408276896703,
"y": 10247.567481745631
},
{
"x": 1209.6294168594352,
"y": 10053.070029074916
},
{
"x": 1271.0577931641828,
"y": 10207.777672576553
},
{
"x": 1185.140255038367,
"y": 9902.050541377459
},
{
"x": 1268.2533151910866,
"y": 10224.056797147852
},
{
"x": 1188.657500953782,
"y": 10034.571242140986
},
{
"x": 1277.9870605770293,
"y": 10173.070680744002
},
{
"x": 1226.084923833901,
"y": 10014.739352989134
},
{
"x": 1268.569384428971,
"y": 10209.830837293928
},
{
"x": 1205.9155607483008,
"y": 9966.917266111142
},
{
"x": 1251.9389756722123,
"y": 10218.497743274285
},
{
"x": 1199.523526920592,
"y": 10020.579152800863
},
{
"x": 1267.028613020384,
"y": 10231.849147862984
},
{
"x": 1212.5089607382001,
"y": 10061.449795117649
},
{
"x": 1256.0706287048156,
"y": 10212.984205398025
},
{
"x": 1217.1558536422854,
"y": 10066.15173009785
},
{
"x": 1264.788460622942,
"y": 10204.727940690282
},
{
"x": 1196.8315757082514,
"y": 10088.29931386239
}
]
}
],
"drilldown": {},
"tooltip": {
"enabled": true,
"useHTML": false,
"format": null,
"headerFormat": "",
"pointFormat": "<span style=\"color:{series.color}\">Single</span>: <b>{point.x:.0f}</b><br><span style=\"color:{series.color}\">Multi</span>: <b>{point.y:.0f}</b>",
"footerFormat": "",
"shared": false,
"outside": false,
"valueDecimals": null,
"split": false
},
"annotations": null
},
"hc_type": "chart",
"id": "177420612611367582238068740724836849084"
}
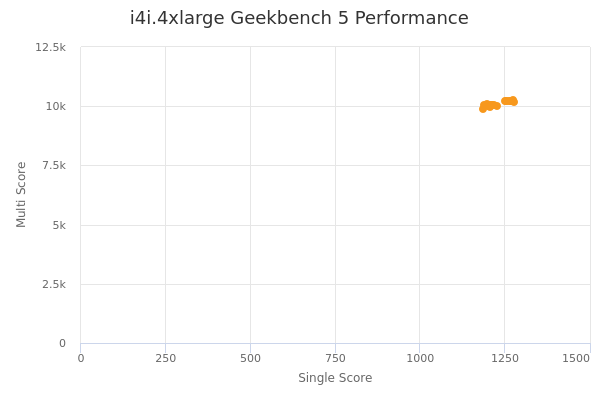
| Single | Multi | |
|---|---|---|
| Max | 1278 | 10248 |
| Average | 1235 | 10121 |
| Deviation | 31.82 | 103.37 |
| Min | 1185 | 9902 |
Sign up as Freemium to get more insight.