i4i.metal by Amazon Web Services
Geekbench is a cross-platform processor benchmark with a scoring system that determines single-core and multi-core performance using loads simulating real-world scenarios. Geekbench 5 score is calculated with a reference score of 2500 representing the performance of the Intel Core i5-2520M @ 2.50 GHz. The software benchmark is available for Mac OS, Windows, Linux, Android and iOS platforms.
Specifications:
CPU
128
RAM
1024.0 GB
Extra
8x
3750 GB
SSD
Net
75000 Mbps
{
"configuration": {
"chart": {
"type": "scatter",
"polar": false,
"zoomType": "",
"options3d": {},
"height": null,
"width": null,
"margin": null,
"inverted": false,
"zooming": {}
},
"credits": {
"enabled": false
},
"title": {
"text": ""
},
"colorAxis": null,
"subtitle": {
"text": ""
},
"xAxis": {
"title": {
"text": [
"Single Score"
],
"useHTML": false,
"style": {
"color": "#666666"
}
},
"categories": null,
"lineWidth": 1,
"tickInterval": null,
"tickWidth": 1,
"tickLength": 10,
"tickPixelInterval": 100,
"plotLines": null,
"labels": {
"enabled": true,
"format": null,
"formatter": "",
"style": {
"color": "#666666",
"cursor": "default",
"fontSize": "11px"
},
"useHTML": false,
"step": 0
},
"plotBands": null,
"visible": true,
"floor": null,
"ceiling": null,
"type": "linear",
"min": 0,
"gridLineWidth": 1,
"gridLineColor": "#e6e6e6",
"minorTickInterval": null,
"minorTickWidth": 0,
"minTickInterval": null,
"startOnTick": true,
"endOnTick": true,
"tickmarkPlacement": 100,
"units": 100,
"minRange": 100
},
"yAxis": {
"title": {
"text": [
"Multi Score"
],
"useHTML": false,
"style": {
"color": "#666666"
}
},
"categories": null,
"plotLines": null,
"plotBands": null,
"lineWidth": null,
"tickInterval": null,
"tickLength": 10,
"floor": null,
"ceiling": null,
"gridLineInterpolation": null,
"gridLineWidth": 1,
"gridLineColor": "#e6e6e6",
"min": 0,
"max": null,
"minorTickInterval": null,
"minorTickWidth": 0,
"minTickInterval": null,
"startOnTick": true,
"endOnTick": true,
"minRange": null,
"type": "linear",
"tickmarkPlacement": null,
"labels": {
"enabled": true,
"formatter": null,
"style": {
"color": "#666666",
"cursor": "default",
"fontSize": "11px"
},
"useHTML": false
}
},
"zAxis": {
"title": {
"text": "Multi Score"
}
},
"plotOptions": {
"series": {
"dataLabels": {
"enabled": false,
"format": null,
"distance": 30,
"align": "center",
"inside": null,
"allowOverlap": false,
"style": {
"fontSize": "11px"
}
},
"showInLegend": null,
"turboThreshold": 0,
"stacking": "",
"groupPadding": 0.2,
"centerInCategory": false,
"findNearestPointBy": "x"
}
},
"navigator": {
"enabled": false
},
"scrollbar": {
"enabled": false
},
"rangeSelector": {
"enabled": false,
"inputEnabled": false
},
"legend": {
"enabled": null,
"maxHeight": null,
"align": "center",
"verticalAlign": "bottom",
"layout": "horizontal",
"width": null,
"margin": 12,
"reversed": false
},
"series": [
{
"name": "i4i.metal by Amazon Web Services",
"color": "#f7981d",
"data": [
{
"x": 1268.8164938628445,
"y": 52083.19758928211
},
{
"x": 1278.2020991675322,
"y": 52808.01646535707
},
{
"x": 1278.821689422789,
"y": 52626.97328163808
},
{
"x": 1259.1351589185438,
"y": 51933.54436268497
},
{
"x": 1268.0003942248718,
"y": 52545.251055979345
},
{
"x": 1260.1243738981234,
"y": 52008.655759628484
},
{
"x": 1266.72140750128,
"y": 53565.321733622375
},
{
"x": 1260.3100222172964,
"y": 51126.62736022352
},
{
"x": 1268.6262499981199,
"y": 52467.3557506301
},
{
"x": 1260.027328958728,
"y": 53367.8791734853
},
{
"x": 1267.637200801474,
"y": 52664.01572871036
},
{
"x": 1259.8343264969108,
"y": 53077.72276561716
},
{
"x": 1260.3273456039547,
"y": 53165.625391423106
},
{
"x": 1262.6145011787128,
"y": 53067.32841663963
},
{
"x": 1268.5853438481404,
"y": 53060.0648132904
},
{
"x": 1260.2025846437114,
"y": 52827.17329552961
},
{
"x": 1268.6172441201068,
"y": 51799.163641454026
},
{
"x": 1259.8502325765576,
"y": 52100.26748474586
},
{
"x": 1268.089346313206,
"y": 51639.93324497611
},
{
"x": 1258.3763638678206,
"y": 51477.778136352084
}
]
}
],
"drilldown": {},
"tooltip": {
"enabled": true,
"useHTML": false,
"format": null,
"headerFormat": "",
"pointFormat": "<span style=\"color:{series.color}\">Single</span>: <b>{point.x:.0f}</b><br><span style=\"color:{series.color}\">Multi</span>: <b>{point.y:.0f}</b>",
"footerFormat": "",
"shared": false,
"outside": false,
"valueDecimals": null,
"split": false
},
"annotations": null
},
"hc_type": "chart",
"id": "74450567008812425361686377781410085518"
}
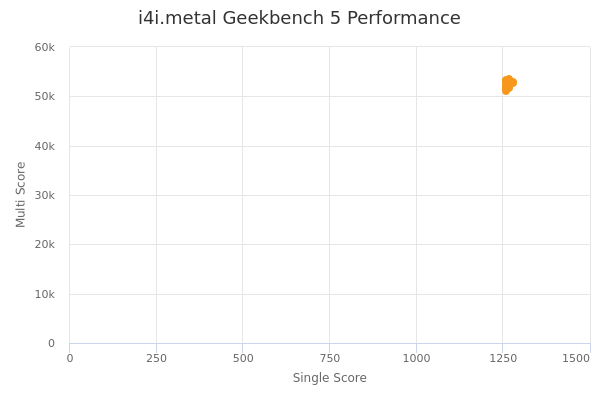
| Single | Multi | |
|---|---|---|
| Max | 1279 | 53565 |
| Average | 1265 | 52471 |
| Deviation | 5.91 | 655.33 |
| Min | 1258 | 51127 |
Sign up as Freemium to get more insight.