c6in.4xlarge by Amazon Web Services
Geekbench is a cross-platform processor benchmark with a scoring system that determines single-core and multi-core performance using loads simulating real-world scenarios. Geekbench 5 score is calculated with a reference score of 2500 representing the performance of the Intel Core i5-2520M @ 2.50 GHz. The software benchmark is available for Mac OS, Windows, Linux, Android and iOS platforms.
Specifications:
CPU
16
RAM
32.0 GB
Net
50000 Mbps
{
"configuration": {
"chart": {
"type": "scatter",
"polar": false,
"zoomType": "",
"options3d": {},
"height": null,
"width": null,
"margin": null,
"inverted": false,
"zooming": {}
},
"credits": {
"enabled": false
},
"title": {
"text": ""
},
"colorAxis": null,
"subtitle": {
"text": ""
},
"xAxis": {
"title": {
"text": [
"Single Score"
],
"useHTML": false,
"style": {
"color": "#666666"
}
},
"categories": null,
"lineWidth": 1,
"tickInterval": null,
"tickWidth": 1,
"tickLength": 10,
"tickPixelInterval": 100,
"plotLines": null,
"labels": {
"enabled": true,
"format": null,
"formatter": "",
"style": {
"color": "#666666",
"cursor": "default",
"fontSize": "11px"
},
"useHTML": false,
"step": 0
},
"plotBands": null,
"visible": true,
"floor": null,
"ceiling": null,
"type": "linear",
"min": 0,
"gridLineWidth": 1,
"gridLineColor": "#e6e6e6",
"minorTickInterval": null,
"minorTickWidth": 0,
"minTickInterval": null,
"startOnTick": true,
"endOnTick": true,
"tickmarkPlacement": 100,
"units": 100,
"minRange": 100
},
"yAxis": {
"title": {
"text": [
"Multi Score"
],
"useHTML": false,
"style": {
"color": "#666666"
}
},
"categories": null,
"plotLines": null,
"plotBands": null,
"lineWidth": null,
"tickInterval": null,
"tickLength": 10,
"floor": null,
"ceiling": null,
"gridLineInterpolation": null,
"gridLineWidth": 1,
"gridLineColor": "#e6e6e6",
"min": 0,
"max": null,
"minorTickInterval": null,
"minorTickWidth": 0,
"minTickInterval": null,
"startOnTick": true,
"endOnTick": true,
"minRange": null,
"type": "linear",
"tickmarkPlacement": null,
"labels": {
"enabled": true,
"formatter": null,
"style": {
"color": "#666666",
"cursor": "default",
"fontSize": "11px"
},
"useHTML": false
}
},
"zAxis": {
"title": {
"text": "Multi Score"
}
},
"plotOptions": {
"series": {
"dataLabels": {
"enabled": false,
"format": null,
"distance": 30,
"align": "center",
"inside": null,
"allowOverlap": false,
"style": {
"fontSize": "11px"
}
},
"showInLegend": null,
"turboThreshold": 0,
"stacking": "",
"groupPadding": 0.2,
"centerInCategory": false,
"findNearestPointBy": "x"
}
},
"navigator": {
"enabled": false
},
"scrollbar": {
"enabled": false
},
"rangeSelector": {
"enabled": false,
"inputEnabled": false
},
"legend": {
"enabled": null,
"maxHeight": null,
"align": "center",
"verticalAlign": "bottom",
"layout": "horizontal",
"width": null,
"margin": 12,
"reversed": false
},
"series": [
{
"name": "c6in.4xlarge by Amazon Web Services",
"color": "#f7981d",
"data": [
{
"x": 1242.0919649104053,
"y": 9832.220718137149
},
{
"x": 1229.2853560392837,
"y": 9911.267122603735
},
{
"x": 1231.1553237578273,
"y": 9906.709512413468
},
{
"x": 1242.392253343961,
"y": 9955.370534166526
},
{
"x": 1252.0632421465361,
"y": 9946.933429677902
},
{
"x": 1244.8934116659643,
"y": 9942.797372091358
},
{
"x": 1257.4101007251836,
"y": 9962.752157671173
},
{
"x": 1252.941866226508,
"y": 9968.250638455258
},
{
"x": 1258.4081446311184,
"y": 9974.777839204817
},
{
"x": 1263.3274420709208,
"y": 9961.767561531411
},
{
"x": 1259.3347429249957,
"y": 9940.324684679052
},
{
"x": 1262.6546592511872,
"y": 9939.774344515426
},
{
"x": 1262.3914948933334,
"y": 9974.251438044777
},
{
"x": 1249.8286694383191,
"y": 9987.788841499332
},
{
"x": 1267.1660979037533,
"y": 9991.08575777653
},
{
"x": 1257.0247511348198,
"y": 10043.642027548834
},
{
"x": 1263.9892589753958,
"y": 10087.008913921092
},
{
"x": 1242.9490036019533,
"y": 10020.15259203045
},
{
"x": 1240.1103188361121,
"y": 10087.105048010504
},
{
"x": 1252.1975366249817,
"y": 10034.23627004545
}
]
}
],
"drilldown": {},
"tooltip": {
"enabled": true,
"useHTML": false,
"format": null,
"headerFormat": "",
"pointFormat": "<span style=\"color:{series.color}\">Single</span>: <b>{point.x:.0f}</b><br><span style=\"color:{series.color}\">Multi</span>: <b>{point.y:.0f}</b>",
"footerFormat": "",
"shared": false,
"outside": false,
"valueDecimals": null,
"split": false
},
"annotations": null
},
"hc_type": "chart",
"id": "335344903115497882290230471741523239906"
}
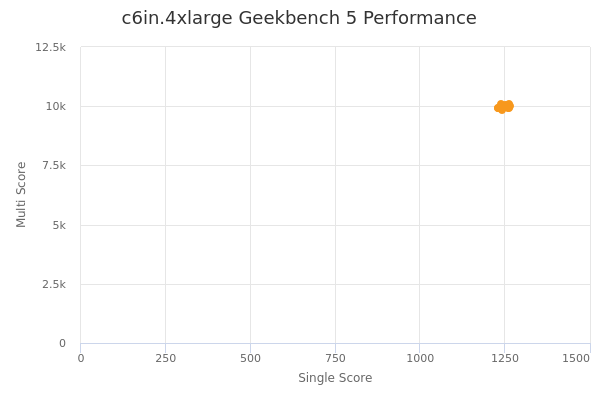
| Single | Multi | |
|---|---|---|
| Max | 1267 | 10087 |
| Average | 1252 | 9973 |
| Deviation | 10.70 | 59.11 |
| Min | 1229 | 9832 |
Sign up as Freemium to get more insight.