c6in.24xlarge by Amazon Web Services
Geekbench is a cross-platform processor benchmark with a scoring system that determines single-core and multi-core performance using loads simulating real-world scenarios. Geekbench 5 score is calculated with a reference score of 2500 representing the performance of the Intel Core i5-2520M @ 2.50 GHz. The software benchmark is available for Mac OS, Windows, Linux, Android and iOS platforms.
Specifications:
CPU
96
RAM
192.0 GB
Net
150000 Mbps
{
"configuration": {
"chart": {
"type": "scatter",
"polar": false,
"zoomType": "",
"options3d": {},
"height": null,
"width": null,
"margin": null,
"inverted": false,
"zooming": {}
},
"credits": {
"enabled": false
},
"title": {
"text": ""
},
"colorAxis": null,
"subtitle": {
"text": ""
},
"xAxis": {
"title": {
"text": [
"Single Score"
],
"useHTML": false,
"style": {
"color": "#666666"
}
},
"categories": null,
"lineWidth": 1,
"tickInterval": null,
"tickWidth": 1,
"tickLength": 10,
"tickPixelInterval": 100,
"plotLines": null,
"labels": {
"enabled": true,
"format": null,
"formatter": "",
"style": {
"color": "#666666",
"cursor": "default",
"fontSize": "11px"
},
"useHTML": false,
"step": 0
},
"plotBands": null,
"visible": true,
"floor": null,
"ceiling": null,
"type": "linear",
"min": 0,
"gridLineWidth": 1,
"gridLineColor": "#e6e6e6",
"minorTickInterval": null,
"minorTickWidth": 0,
"minTickInterval": null,
"startOnTick": true,
"endOnTick": true,
"tickmarkPlacement": 100,
"units": 100,
"minRange": 100
},
"yAxis": {
"title": {
"text": [
"Multi Score"
],
"useHTML": false,
"style": {
"color": "#666666"
}
},
"categories": null,
"plotLines": null,
"plotBands": null,
"lineWidth": null,
"tickInterval": null,
"tickLength": 10,
"floor": null,
"ceiling": null,
"gridLineInterpolation": null,
"gridLineWidth": 1,
"gridLineColor": "#e6e6e6",
"min": 0,
"max": null,
"minorTickInterval": null,
"minorTickWidth": 0,
"minTickInterval": null,
"startOnTick": true,
"endOnTick": true,
"minRange": null,
"type": "linear",
"tickmarkPlacement": null,
"labels": {
"enabled": true,
"formatter": null,
"style": {
"color": "#666666",
"cursor": "default",
"fontSize": "11px"
},
"useHTML": false
}
},
"zAxis": {
"title": {
"text": "Multi Score"
}
},
"plotOptions": {
"series": {
"dataLabels": {
"enabled": false,
"format": null,
"distance": 30,
"align": "center",
"inside": null,
"allowOverlap": false,
"style": {
"fontSize": "11px"
}
},
"showInLegend": null,
"turboThreshold": 0,
"stacking": "",
"groupPadding": 0.2,
"centerInCategory": false,
"findNearestPointBy": "x"
}
},
"navigator": {
"enabled": false
},
"scrollbar": {
"enabled": false
},
"rangeSelector": {
"enabled": false,
"inputEnabled": false
},
"legend": {
"enabled": null,
"maxHeight": null,
"align": "center",
"verticalAlign": "bottom",
"layout": "horizontal",
"width": null,
"margin": 12,
"reversed": false
},
"series": [
{
"name": "c6in.24xlarge by Amazon Web Services",
"color": "#f7981d",
"data": [
{
"x": 1264.9865896174829,
"y": 41773.08306146266
},
{
"x": 1263.7639058388183,
"y": 40921.07912171674
},
{
"x": 1267.4731458965423,
"y": 39723.0191197246
},
{
"x": 1266.203638785421,
"y": 42496.54127106375
},
{
"x": 1253.904083257315,
"y": 41902.84744441294
},
{
"x": 1265.8102284081479,
"y": 41198.09952678431
},
{
"x": 1266.8747484556918,
"y": 41583.155717279355
},
{
"x": 1265.3132234336135,
"y": 42254.48215947698
},
{
"x": 1264.4939961767682,
"y": 41749.38897459359
},
{
"x": 1263.926005778138,
"y": 42402.62560780823
},
{
"x": 1267.738018153912,
"y": 40217.8632219492
},
{
"x": 1265.26960061913,
"y": 41408.89141193438
},
{
"x": 1267.5214914909398,
"y": 41774.6799020838
},
{
"x": 1265.570024341706,
"y": 41525.49311269608
},
{
"x": 1266.4934919241482,
"y": 42278.73383255514
},
{
"x": 1266.3981708027386,
"y": 41901.61314058969
},
{
"x": 1266.6624026191785,
"y": 42735.93467712953
},
{
"x": 1249.0962286734703,
"y": 41092.151936325616
},
{
"x": 1252.707236613389,
"y": 42045.40007395523
},
{
"x": 1249.8989509962437,
"y": 41732.42358444052
}
]
}
],
"drilldown": {},
"tooltip": {
"enabled": true,
"useHTML": false,
"format": null,
"headerFormat": "",
"pointFormat": "<span style=\"color:{series.color}\">Single</span>: <b>{point.x:.0f}</b><br><span style=\"color:{series.color}\">Multi</span>: <b>{point.y:.0f}</b>",
"footerFormat": "",
"shared": false,
"outside": false,
"valueDecimals": null,
"split": false
},
"annotations": null
},
"hc_type": "chart",
"id": "281740448095840174360158822194090661546"
}
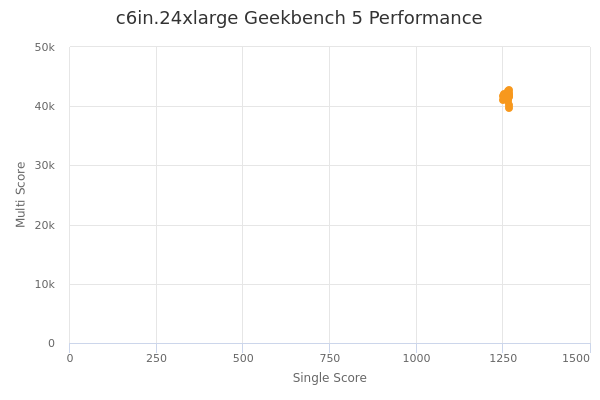
| Single | Multi | |
|---|---|---|
| Max | 1268 | 42736 |
| Average | 1263 | 41636 |
| Deviation | 5.96 | 722.46 |
| Min | 1249 | 39723 |
Sign up as Freemium to get more insight.