c6in.16xlarge by Amazon Web Services
Geekbench is a cross-platform processor benchmark with a scoring system that determines single-core and multi-core performance using loads simulating real-world scenarios. Geekbench 5 score is calculated with a reference score of 2500 representing the performance of the Intel Core i5-2520M @ 2.50 GHz. The software benchmark is available for Mac OS, Windows, Linux, Android and iOS platforms.
Specifications:
CPU
64
RAM
128.0 GB
Net
100000 Mbps
{
"configuration": {
"chart": {
"type": "scatter",
"polar": false,
"zoomType": "",
"options3d": {},
"height": null,
"width": null,
"margin": null,
"inverted": false,
"zooming": {}
},
"credits": {
"enabled": false
},
"title": {
"text": ""
},
"colorAxis": null,
"subtitle": {
"text": ""
},
"xAxis": {
"title": {
"text": [
"Single Score"
],
"useHTML": false,
"style": {
"color": "#666666"
}
},
"categories": null,
"lineWidth": 1,
"tickInterval": null,
"tickWidth": 1,
"tickLength": 10,
"tickPixelInterval": 100,
"plotLines": null,
"labels": {
"enabled": true,
"format": null,
"formatter": "",
"style": {
"color": "#666666",
"cursor": "default",
"fontSize": "11px"
},
"useHTML": false,
"step": 0
},
"plotBands": null,
"visible": true,
"floor": null,
"ceiling": null,
"type": "linear",
"min": 0,
"gridLineWidth": 1,
"gridLineColor": "#e6e6e6",
"minorTickInterval": null,
"minorTickWidth": 0,
"minTickInterval": null,
"startOnTick": true,
"endOnTick": true,
"tickmarkPlacement": 100,
"units": 100,
"minRange": 100
},
"yAxis": {
"title": {
"text": [
"Multi Score"
],
"useHTML": false,
"style": {
"color": "#666666"
}
},
"categories": null,
"plotLines": null,
"plotBands": null,
"lineWidth": null,
"tickInterval": null,
"tickLength": 10,
"floor": null,
"ceiling": null,
"gridLineInterpolation": null,
"gridLineWidth": 1,
"gridLineColor": "#e6e6e6",
"min": 0,
"max": null,
"minorTickInterval": null,
"minorTickWidth": 0,
"minTickInterval": null,
"startOnTick": true,
"endOnTick": true,
"minRange": null,
"type": "linear",
"tickmarkPlacement": null,
"labels": {
"enabled": true,
"formatter": null,
"style": {
"color": "#666666",
"cursor": "default",
"fontSize": "11px"
},
"useHTML": false
}
},
"zAxis": {
"title": {
"text": "Multi Score"
}
},
"plotOptions": {
"series": {
"dataLabels": {
"enabled": false,
"format": null,
"distance": 30,
"align": "center",
"inside": null,
"allowOverlap": false,
"style": {
"fontSize": "11px"
}
},
"showInLegend": null,
"turboThreshold": 0,
"stacking": "",
"groupPadding": 0.2,
"centerInCategory": false,
"findNearestPointBy": "x"
}
},
"navigator": {
"enabled": false
},
"scrollbar": {
"enabled": false
},
"rangeSelector": {
"enabled": false,
"inputEnabled": false
},
"legend": {
"enabled": null,
"maxHeight": null,
"align": "center",
"verticalAlign": "bottom",
"layout": "horizontal",
"width": null,
"margin": 12,
"reversed": false
},
"series": [
{
"name": "c6in.16xlarge by Amazon Web Services",
"color": "#f7981d",
"data": [
{
"x": 1262.9059650163645,
"y": 31428.260776180246
},
{
"x": 1265.8591889039353,
"y": 31348.372826773935
},
{
"x": 1267.3255546573057,
"y": 30445.70723420986
},
{
"x": 1259.6676553249454,
"y": 30007.34694795448
},
{
"x": 1263.261342675273,
"y": 31026.503783106473
},
{
"x": 1270.5061640360054,
"y": 30870.718669552865
},
{
"x": 1262.3661426398144,
"y": 31616.557355949455
},
{
"x": 1267.923648171232,
"y": 30617.74433321821
},
{
"x": 1260.6906585472418,
"y": 30185.65372086985
},
{
"x": 1266.312069650498,
"y": 31074.75312914177
},
{
"x": 1262.2028738301542,
"y": 31626.90909383739
},
{
"x": 1258.2510532468566,
"y": 29952.803627853747
},
{
"x": 1255.1028718716927,
"y": 31614.29570769996
},
{
"x": 1259.840462735573,
"y": 29856.912410450394
},
{
"x": 1252.921844584866,
"y": 31773.936495317597
},
{
"x": 1266.0627276722175,
"y": 29868.325451347227
},
{
"x": 1252.9978443926104,
"y": 31033.353367916432
},
{
"x": 1251.1578834346296,
"y": 30585.88145417394
},
{
"x": 1255.4592234191857,
"y": 30575.506143487808
},
{
"x": 1266.0444507453276,
"y": 29896.348190173914
}
]
}
],
"drilldown": {},
"tooltip": {
"enabled": true,
"useHTML": false,
"format": null,
"headerFormat": "",
"pointFormat": "<span style=\"color:{series.color}\">Single</span>: <b>{point.x:.0f}</b><br><span style=\"color:{series.color}\">Multi</span>: <b>{point.y:.0f}</b>",
"footerFormat": "",
"shared": false,
"outside": false,
"valueDecimals": null,
"split": false
},
"annotations": null
},
"hc_type": "chart",
"id": "126145486312256607669917780305134178515"
}
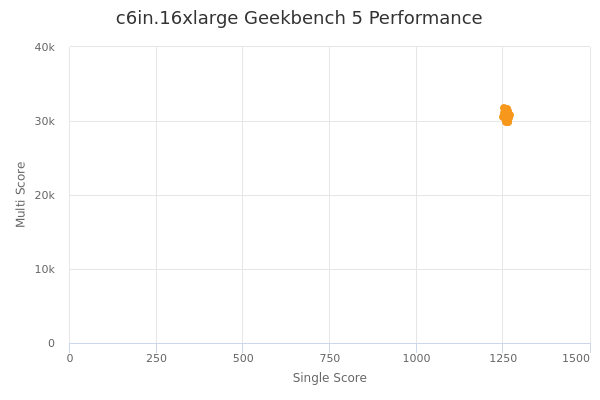
| Single | Multi | |
|---|---|---|
| Max | 1271 | 31774 |
| Average | 1261 | 30770 |
| Deviation | 5.45 | 647.25 |
| Min | 1251 | 29857 |
Sign up as Freemium to get more insight.