c6in.large by Amazon Web Services
Geekbench is a cross-platform processor benchmark with a scoring system that determines single-core and multi-core performance using loads simulating real-world scenarios. Geekbench 5 score is calculated with a reference score of 2500 representing the performance of the Intel Core i5-2520M @ 2.50 GHz. The software benchmark is available for Mac OS, Windows, Linux, Android and iOS platforms.
Specifications:
CPU
2
RAM
4.0 GB
Net
25000 Mbps
{
"configuration": {
"chart": {
"type": "scatter",
"polar": false,
"zoomType": "",
"options3d": {},
"height": null,
"width": null,
"margin": null,
"inverted": false,
"zooming": {}
},
"credits": {
"enabled": false
},
"title": {
"text": ""
},
"colorAxis": null,
"subtitle": {
"text": ""
},
"xAxis": {
"title": {
"text": [
"Single Score"
],
"useHTML": false,
"style": {
"color": "#666666"
}
},
"categories": null,
"lineWidth": 1,
"tickInterval": null,
"tickWidth": 1,
"tickLength": 10,
"tickPixelInterval": 100,
"plotLines": null,
"labels": {
"enabled": true,
"format": null,
"formatter": "",
"style": {
"color": "#666666",
"cursor": "default",
"fontSize": "11px"
},
"useHTML": false,
"step": 0
},
"plotBands": null,
"visible": true,
"floor": null,
"ceiling": null,
"type": "linear",
"min": 0,
"gridLineWidth": 1,
"gridLineColor": "#e6e6e6",
"minorTickInterval": null,
"minorTickWidth": 0,
"minTickInterval": null,
"startOnTick": true,
"endOnTick": true,
"tickmarkPlacement": 100,
"units": 100,
"minRange": 100
},
"yAxis": {
"title": {
"text": [
"Multi Score"
],
"useHTML": false,
"style": {
"color": "#666666"
}
},
"categories": null,
"plotLines": null,
"plotBands": null,
"lineWidth": null,
"tickInterval": null,
"tickLength": 10,
"floor": null,
"ceiling": null,
"gridLineInterpolation": null,
"gridLineWidth": 1,
"gridLineColor": "#e6e6e6",
"min": 0,
"max": null,
"minorTickInterval": null,
"minorTickWidth": 0,
"minTickInterval": null,
"startOnTick": true,
"endOnTick": true,
"minRange": null,
"type": "linear",
"tickmarkPlacement": null,
"labels": {
"enabled": true,
"formatter": null,
"style": {
"color": "#666666",
"cursor": "default",
"fontSize": "11px"
},
"useHTML": false
}
},
"zAxis": {
"title": {
"text": "Multi Score"
}
},
"plotOptions": {
"series": {
"dataLabels": {
"enabled": false,
"format": null,
"distance": 30,
"align": "center",
"inside": null,
"allowOverlap": false,
"style": {
"fontSize": "11px"
}
},
"showInLegend": null,
"turboThreshold": 0,
"stacking": "",
"groupPadding": 0.2,
"centerInCategory": false,
"findNearestPointBy": "x"
}
},
"navigator": {
"enabled": false
},
"scrollbar": {
"enabled": false
},
"rangeSelector": {
"enabled": false,
"inputEnabled": false
},
"legend": {
"enabled": null,
"maxHeight": null,
"align": "center",
"verticalAlign": "bottom",
"layout": "horizontal",
"width": null,
"margin": 12,
"reversed": false
},
"series": [
{
"name": "c6in.large by Amazon Web Services",
"color": "#f7981d",
"data": [
{
"x": 1217.2595313076788,
"y": 1421.5075009620261
},
{
"x": 1182.6195140290288,
"y": 1389.922828722769
},
{
"x": 1211.260856950358,
"y": 1420.874368965391
},
{
"x": 1176.847378995927,
"y": 1388.2354615355682
},
{
"x": 1211.3264843821855,
"y": 1415.3794038996534
},
{
"x": 1183.4216397356604,
"y": 1383.0166416673405
},
{
"x": 1212.3584340874431,
"y": 1411.2798160326838
},
{
"x": 1178.9833365334875,
"y": 1381.1083148059633
},
{
"x": 1207.8597987141202,
"y": 1405.08446861785
},
{
"x": 1180.623716333459,
"y": 1382.44390867697
},
{
"x": 1216.2571789246767,
"y": 1426.6085679569428
},
{
"x": 1178.082987110624,
"y": 1393.3298537994754
},
{
"x": 1211.4166486977372,
"y": 1400.6678349673027
},
{
"x": 1182.4343418453477,
"y": 1376.2882113596022
},
{
"x": 1212.7589747143475,
"y": 1401.8071073720841
},
{
"x": 1177.5617130103478,
"y": 1384.056477513268
},
{
"x": 1217.9283860066537,
"y": 1380.146053136236
},
{
"x": 1181.2816404862929,
"y": 1377.4724801432742
},
{
"x": 1209.191982225924,
"y": 1423.2318686288847
},
{
"x": 1187.0842329739069,
"y": 1382.4809551470748
}
]
}
],
"drilldown": {},
"tooltip": {
"enabled": true,
"useHTML": false,
"format": null,
"headerFormat": "",
"pointFormat": "<span style=\"color:{series.color}\">Single</span>: <b>{point.x:.0f}</b><br><span style=\"color:{series.color}\">Multi</span>: <b>{point.y:.0f}</b>",
"footerFormat": "",
"shared": false,
"outside": false,
"valueDecimals": null,
"split": false
},
"annotations": null
},
"hc_type": "chart",
"id": "184120616425772941824410822765961327145"
}
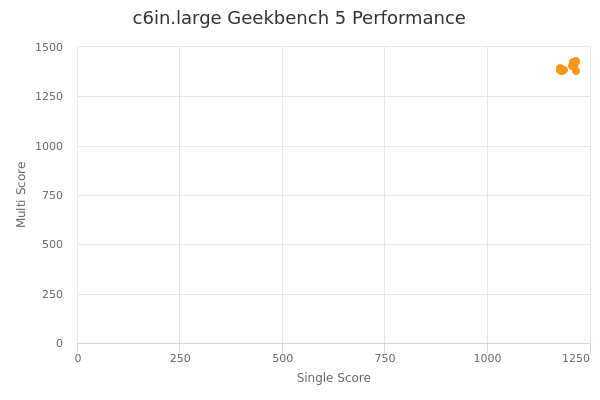
| Single | Multi | |
|---|---|---|
| Max | 1218 | 1427 |
| Average | 1197 | 1397 |
| Deviation | 16.23 | 16.81 |
| Min | 1177 | 1376 |
Sign up as Freemium to get more insight.