c6in.2xlarge by Amazon Web Services
Geekbench is a cross-platform processor benchmark with a scoring system that determines single-core and multi-core performance using loads simulating real-world scenarios. Geekbench 5 score is calculated with a reference score of 2500 representing the performance of the Intel Core i5-2520M @ 2.50 GHz. The software benchmark is available for Mac OS, Windows, Linux, Android and iOS platforms.
Specifications:
CPU
8
RAM
16.0 GB
Net
40000 Mbps
{
"configuration": {
"chart": {
"type": "scatter",
"polar": false,
"zoomType": "",
"options3d": {},
"height": null,
"width": null,
"margin": null,
"inverted": false,
"zooming": {}
},
"credits": {
"enabled": false
},
"title": {
"text": ""
},
"colorAxis": null,
"subtitle": {
"text": ""
},
"xAxis": {
"title": {
"text": [
"Single Score"
],
"useHTML": false,
"style": {
"color": "#666666"
}
},
"categories": null,
"lineWidth": 1,
"tickInterval": null,
"tickWidth": 1,
"tickLength": 10,
"tickPixelInterval": 100,
"plotLines": null,
"labels": {
"enabled": true,
"format": null,
"formatter": "",
"style": {
"color": "#666666",
"cursor": "default",
"fontSize": "11px"
},
"useHTML": false,
"step": 0
},
"plotBands": null,
"visible": true,
"floor": null,
"ceiling": null,
"type": "linear",
"min": 0,
"gridLineWidth": 1,
"gridLineColor": "#e6e6e6",
"minorTickInterval": null,
"minorTickWidth": 0,
"minTickInterval": null,
"startOnTick": true,
"endOnTick": true,
"tickmarkPlacement": 100,
"units": 100,
"minRange": 100
},
"yAxis": {
"title": {
"text": [
"Multi Score"
],
"useHTML": false,
"style": {
"color": "#666666"
}
},
"categories": null,
"plotLines": null,
"plotBands": null,
"lineWidth": null,
"tickInterval": null,
"tickLength": 10,
"floor": null,
"ceiling": null,
"gridLineInterpolation": null,
"gridLineWidth": 1,
"gridLineColor": "#e6e6e6",
"min": 0,
"max": null,
"minorTickInterval": null,
"minorTickWidth": 0,
"minTickInterval": null,
"startOnTick": true,
"endOnTick": true,
"minRange": null,
"type": "linear",
"tickmarkPlacement": null,
"labels": {
"enabled": true,
"formatter": null,
"style": {
"color": "#666666",
"cursor": "default",
"fontSize": "11px"
},
"useHTML": false
}
},
"zAxis": {
"title": {
"text": "Multi Score"
}
},
"plotOptions": {
"series": {
"dataLabels": {
"enabled": false,
"format": null,
"distance": 30,
"align": "center",
"inside": null,
"allowOverlap": false,
"style": {
"fontSize": "11px"
}
},
"showInLegend": null,
"turboThreshold": 0,
"stacking": "",
"groupPadding": 0.2,
"centerInCategory": false,
"findNearestPointBy": "x"
}
},
"navigator": {
"enabled": false
},
"scrollbar": {
"enabled": false
},
"rangeSelector": {
"enabled": false,
"inputEnabled": false
},
"legend": {
"enabled": null,
"maxHeight": null,
"align": "center",
"verticalAlign": "bottom",
"layout": "horizontal",
"width": null,
"margin": 12,
"reversed": false
},
"series": [
{
"name": "c6in.2xlarge by Amazon Web Services",
"color": "#f7981d",
"data": [
{
"x": 1226.949659622745,
"y": 5375.0705333008445
},
{
"x": 1224.8348538171203,
"y": 5371.976902614628
},
{
"x": 1226.022649140693,
"y": 5365.751639119408
},
{
"x": 1217.7323069098509,
"y": 5353.858039233992
},
{
"x": 1233.5487333247502,
"y": 5369.046814608557
},
{
"x": 1227.986029590263,
"y": 5356.0789638757005
},
{
"x": 1229.2372849078856,
"y": 5370.43313757067
},
{
"x": 1219.702880639407,
"y": 5362.1272083264175
},
{
"x": 1230.475779073518,
"y": 5368.255222153968
},
{
"x": 1223.685757502795,
"y": 5356.89834480616
},
{
"x": 1227.6855785714934,
"y": 5376.204264986434
},
{
"x": 1222.8334871977222,
"y": 5355.236497589672
},
{
"x": 1231.8897070081782,
"y": 5373.533279777222
},
{
"x": 1223.6515064791965,
"y": 5358.097921251078
},
{
"x": 1234.0024751795504,
"y": 5373.026174221079
},
{
"x": 1225.8133096348706,
"y": 5369.108825923382
},
{
"x": 1222.3404493486623,
"y": 5369.660086974785
},
{
"x": 1229.8193116899224,
"y": 5367.154426673815
},
{
"x": 1230.1497678369058,
"y": 5350.725073707696
},
{
"x": 1234.3605835362969,
"y": 5358.52011233642
}
]
}
],
"drilldown": {},
"tooltip": {
"enabled": true,
"useHTML": false,
"format": null,
"headerFormat": "",
"pointFormat": "<span style=\"color:{series.color}\">Single</span>: <b>{point.x:.0f}</b><br><span style=\"color:{series.color}\">Multi</span>: <b>{point.y:.0f}</b>",
"footerFormat": "",
"shared": false,
"outside": false,
"valueDecimals": null,
"split": false
},
"annotations": null
},
"hc_type": "chart",
"id": "176893028716476268293899813030851964294"
}
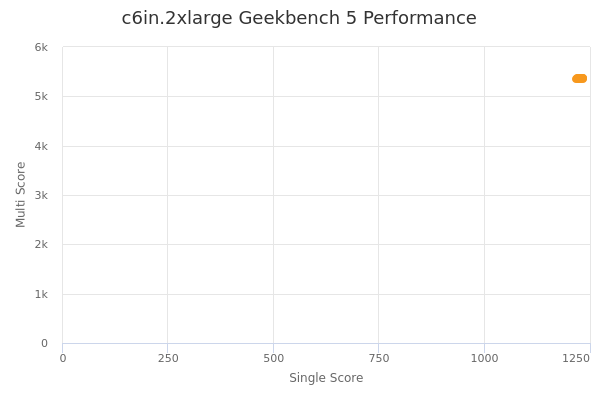
| Single | Multi | |
|---|---|---|
| Max | 1234 | 5376 |
| Average | 1227 | 5365 |
| Deviation | 4.55 | 7.68 |
| Min | 1218 | 5351 |
Sign up as Freemium to get more insight.