c6i.24xlarge by Amazon Web Services
Geekbench is a cross-platform processor benchmark with a scoring system that determines single-core and multi-core performance using loads simulating real-world scenarios. Geekbench 5 score is calculated with a reference score of 2500 representing the performance of the Intel Core i5-2520M @ 2.50 GHz. The software benchmark is available for Mac OS, Windows, Linux, Android and iOS platforms.
Specifications:
CPU
96
RAM
192.0 GB
Net
37500 Mbps
{
"configuration": {
"chart": {
"type": "scatter",
"polar": false,
"zoomType": "",
"options3d": {},
"height": null,
"width": null,
"margin": null,
"inverted": false,
"zooming": {}
},
"credits": {
"enabled": false
},
"title": {
"text": ""
},
"colorAxis": null,
"subtitle": {
"text": ""
},
"xAxis": {
"title": {
"text": [
"Single Score"
],
"useHTML": false,
"style": {
"color": "#666666"
}
},
"categories": null,
"lineWidth": 1,
"tickInterval": null,
"tickWidth": 1,
"tickLength": 10,
"tickPixelInterval": 100,
"plotLines": null,
"labels": {
"enabled": true,
"format": null,
"formatter": "",
"style": {
"color": "#666666",
"cursor": "default",
"fontSize": "11px"
},
"useHTML": false,
"step": 0
},
"plotBands": null,
"visible": true,
"floor": null,
"ceiling": null,
"type": "linear",
"min": 0,
"gridLineWidth": 1,
"gridLineColor": "#e6e6e6",
"minorTickInterval": null,
"minorTickWidth": 0,
"minTickInterval": null,
"startOnTick": true,
"endOnTick": true,
"tickmarkPlacement": 100,
"units": 100,
"minRange": 100
},
"yAxis": {
"title": {
"text": [
"Multi Score"
],
"useHTML": false,
"style": {
"color": "#666666"
}
},
"categories": null,
"plotLines": null,
"plotBands": null,
"lineWidth": null,
"tickInterval": null,
"tickLength": 10,
"floor": null,
"ceiling": null,
"gridLineInterpolation": null,
"gridLineWidth": 1,
"gridLineColor": "#e6e6e6",
"min": 0,
"max": null,
"minorTickInterval": null,
"minorTickWidth": 0,
"minTickInterval": null,
"startOnTick": true,
"endOnTick": true,
"minRange": null,
"type": "linear",
"tickmarkPlacement": null,
"labels": {
"enabled": true,
"formatter": null,
"style": {
"color": "#666666",
"cursor": "default",
"fontSize": "11px"
},
"useHTML": false
}
},
"zAxis": {
"title": {
"text": "Multi Score"
}
},
"plotOptions": {
"series": {
"dataLabels": {
"enabled": false,
"format": null,
"distance": 30,
"align": "center",
"inside": null,
"allowOverlap": false,
"style": {
"fontSize": "11px"
}
},
"showInLegend": null,
"turboThreshold": 0,
"stacking": "",
"groupPadding": 0.2,
"centerInCategory": false,
"findNearestPointBy": "x"
}
},
"navigator": {
"enabled": false
},
"scrollbar": {
"enabled": false
},
"rangeSelector": {
"enabled": false,
"inputEnabled": false
},
"legend": {
"enabled": null,
"maxHeight": null,
"align": "center",
"verticalAlign": "bottom",
"layout": "horizontal",
"width": null,
"margin": 12,
"reversed": false
},
"series": [
{
"name": "c6i.24xlarge by Amazon Web Services",
"color": "#f7981d",
"data": [
{
"x": 1265.6360480156297,
"y": 40719.41267901084
},
{
"x": 1257.7628088953218,
"y": 43198.69669530392
},
{
"x": 1261.3758966079026,
"y": 40143.79974167353
},
{
"x": 1235.8385557242862,
"y": 40400.3521670353
},
{
"x": 1256.2576692548578,
"y": 41335.97537569917
},
{
"x": 1219.5436991008442,
"y": 41379.008745799794
},
{
"x": 1240.6053165515054,
"y": 40688.046139331746
},
{
"x": 1266.032596081378,
"y": 41447.719292643465
},
{
"x": 1237.358330241916,
"y": 41211.84380896664
},
{
"x": 1272.2825998802018,
"y": 40569.66331542041
},
{
"x": 1270.7012563429168,
"y": 40586.84698925759
},
{
"x": 1254.30335765791,
"y": 40107.871450534905
},
{
"x": 1271.0842998970134,
"y": 40154.195764054835
},
{
"x": 1240.856717814354,
"y": 42611.591527955876
},
{
"x": 1270.2085450348193,
"y": 42350.299495236104
},
{
"x": 1257.8430432684058,
"y": 41665.51221866009
},
{
"x": 1269.3421282366298,
"y": 42749.60116803824
},
{
"x": 1247.7330644539986,
"y": 41282.00378880181
},
{
"x": 1271.3936367351114,
"y": 42070.959653842496
},
{
"x": 1234.6020098180575,
"y": 40949.91537186904
}
]
}
],
"drilldown": {},
"tooltip": {
"enabled": true,
"useHTML": false,
"format": null,
"headerFormat": "",
"pointFormat": "<span style=\"color:{series.color}\">Single</span>: <b>{point.x:.0f}</b><br><span style=\"color:{series.color}\">Multi</span>: <b>{point.y:.0f}</b>",
"footerFormat": "",
"shared": false,
"outside": false,
"valueDecimals": null,
"split": false
},
"annotations": null
},
"hc_type": "chart",
"id": "253897327582474640613010574163341011083"
}
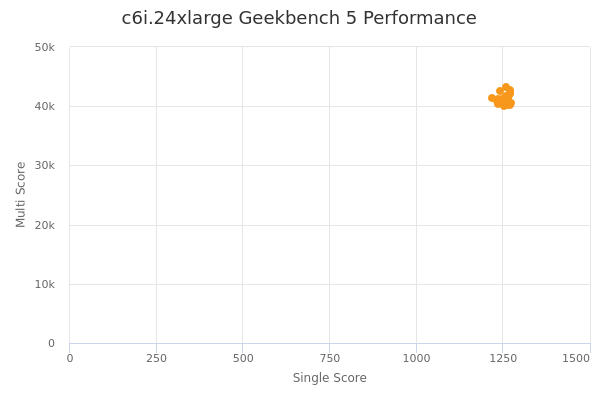
| Single | Multi | |
|---|---|---|
| Max | 1272 | 43199 |
| Average | 1255 | 41281 |
| Deviation | 15.19 | 895.67 |
| Min | 1220 | 40108 |
Sign up as Freemium to get more insight.