c6i.metal by Amazon Web Services
Geekbench is a cross-platform processor benchmark with a scoring system that determines single-core and multi-core performance using loads simulating real-world scenarios. Geekbench 5 score is calculated with a reference score of 2500 representing the performance of the Intel Core i5-2520M @ 2.50 GHz. The software benchmark is available for Mac OS, Windows, Linux, Android and iOS platforms.
Specifications:
CPU
128
RAM
256.0 GB
Net
50000 Mbps
{
"configuration": {
"chart": {
"type": "scatter",
"polar": false,
"zoomType": "",
"options3d": {},
"height": null,
"width": null,
"margin": null,
"inverted": false,
"zooming": {}
},
"credits": {
"enabled": false
},
"title": {
"text": ""
},
"colorAxis": null,
"subtitle": {
"text": ""
},
"xAxis": {
"title": {
"text": [
"Single Score"
],
"useHTML": false,
"style": {
"color": "#666666"
}
},
"categories": null,
"lineWidth": 1,
"tickInterval": null,
"tickWidth": 1,
"tickLength": 10,
"tickPixelInterval": 100,
"plotLines": null,
"labels": {
"enabled": true,
"format": null,
"formatter": "",
"style": {
"color": "#666666",
"cursor": "default",
"fontSize": "11px"
},
"useHTML": false,
"step": 0
},
"plotBands": null,
"visible": true,
"floor": null,
"ceiling": null,
"type": "linear",
"min": 0,
"gridLineWidth": 1,
"gridLineColor": "#e6e6e6",
"minorTickInterval": null,
"minorTickWidth": 0,
"minTickInterval": null,
"startOnTick": true,
"endOnTick": true,
"tickmarkPlacement": 100,
"units": 100,
"minRange": 100
},
"yAxis": {
"title": {
"text": [
"Multi Score"
],
"useHTML": false,
"style": {
"color": "#666666"
}
},
"categories": null,
"plotLines": null,
"plotBands": null,
"lineWidth": null,
"tickInterval": null,
"tickLength": 10,
"floor": null,
"ceiling": null,
"gridLineInterpolation": null,
"gridLineWidth": 1,
"gridLineColor": "#e6e6e6",
"min": 0,
"max": null,
"minorTickInterval": null,
"minorTickWidth": 0,
"minTickInterval": null,
"startOnTick": true,
"endOnTick": true,
"minRange": null,
"type": "linear",
"tickmarkPlacement": null,
"labels": {
"enabled": true,
"formatter": null,
"style": {
"color": "#666666",
"cursor": "default",
"fontSize": "11px"
},
"useHTML": false
}
},
"zAxis": {
"title": {
"text": "Multi Score"
}
},
"plotOptions": {
"series": {
"dataLabels": {
"enabled": false,
"format": null,
"distance": 30,
"align": "center",
"inside": null,
"allowOverlap": false,
"style": {
"fontSize": "11px"
}
},
"showInLegend": null,
"turboThreshold": 0,
"stacking": "",
"groupPadding": 0.2,
"centerInCategory": false,
"findNearestPointBy": "x"
}
},
"navigator": {
"enabled": false
},
"scrollbar": {
"enabled": false
},
"rangeSelector": {
"enabled": false,
"inputEnabled": false
},
"legend": {
"enabled": null,
"maxHeight": null,
"align": "center",
"verticalAlign": "bottom",
"layout": "horizontal",
"width": null,
"margin": 12,
"reversed": false
},
"series": [
{
"name": "c6i.metal by Amazon Web Services",
"color": "#f7981d",
"data": [
{
"x": 1209.3604324738765,
"y": 44972.508135080374
},
{
"x": 1177.124012136427,
"y": 45503.74593971932
},
{
"x": 1212.6352436837585,
"y": 46113.20116442432
},
{
"x": 1133.2308636451394,
"y": 45659.23137224458
},
{
"x": 1216.2036978888855,
"y": 45876.931920924704
},
{
"x": 1178.3254926476604,
"y": 46395.99864450816
},
{
"x": 1111.7747208544642,
"y": 46413.12539662248
},
{
"x": 1217.3280084783657,
"y": 45516.18559185528
},
{
"x": 1155.4653722908465,
"y": 44836.02253462172
},
{
"x": 1218.1558262633616,
"y": 46345.73885066653
},
{
"x": 1096.6435705831482,
"y": 45381.08991691252
},
{
"x": 1221.0518147910907,
"y": 46314.492931504225
},
{
"x": 1181.230368222337,
"y": 45690.096529825954
},
{
"x": 1217.9510923363944,
"y": 46271.20763164973
},
{
"x": 1212.9542759872402,
"y": 46530.43919769446
},
{
"x": 1195.58828602304,
"y": 46343.36124739928
},
{
"x": 1214.1088189892416,
"y": 45595.6432163559
},
{
"x": 1196.361436456766,
"y": 44868.53064291042
},
{
"x": 1202.8216183906336,
"y": 46675.79495984366
},
{
"x": 1188.341991374652,
"y": 46567.771069700146
},
{
"x": 1090.3670521815393,
"y": 46163.73928317775
},
{
"x": 1225.1648758635517,
"y": 45603.05487597359
},
{
"x": 1196.4927799170027,
"y": 46598.764847590246
},
{
"x": 1198.4701770543397,
"y": 45468.87603795558
},
{
"x": 1087.847088235694,
"y": 46111.907504462695
},
{
"x": 1217.14938417229,
"y": 44916.24654014686
},
{
"x": 1247.5729566371394,
"y": 44768.0519962396
},
{
"x": 1214.726336569222,
"y": 45590.016429465395
},
{
"x": 1212.429453004405,
"y": 45493.21252602
},
{
"x": 1205.474575723602,
"y": 47040.74575887308
},
{
"x": 1140.2982075251925,
"y": 47070.19566648591
},
{
"x": 1189.4443506653981,
"y": 46440.25927615905
},
{
"x": 1163.2543383528982,
"y": 43846.34114460681
},
{
"x": 1204.9679202625114,
"y": 46427.94963479569
},
{
"x": 1179.1031141358392,
"y": 46948.70498931493
},
{
"x": 1176.4818069987555,
"y": 46084.497414050646
},
{
"x": 1073.1202948723476,
"y": 46035.41410623963
},
{
"x": 1158.0602207437692,
"y": 44929.58185195502
},
{
"x": 1132.4665697030548,
"y": 45502.447564114445
},
{
"x": 1197.213182594643,
"y": 46816.96393773009
}
]
}
],
"drilldown": {},
"tooltip": {
"enabled": true,
"useHTML": false,
"format": null,
"headerFormat": "",
"pointFormat": "<span style=\"color:{series.color}\">Single</span>: <b>{point.x:.0f}</b><br><span style=\"color:{series.color}\">Multi</span>: <b>{point.y:.0f}</b>",
"footerFormat": "",
"shared": false,
"outside": false,
"valueDecimals": null,
"split": false
},
"annotations": null
},
"hc_type": "chart",
"id": "238953159095557654132795104976941480477"
}
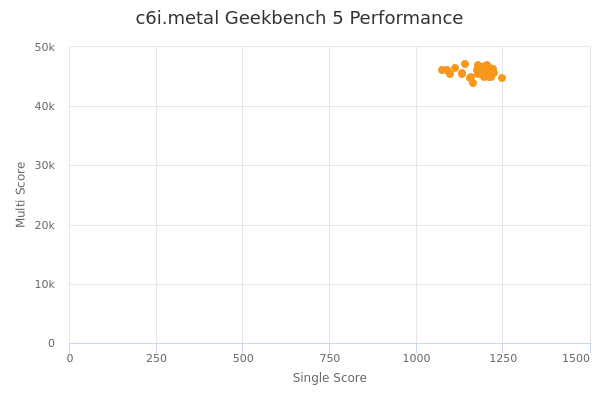
| Single | Multi | |
|---|---|---|
| Max | 1248 | 47070 |
| Average | 1182 | 45893 |
| Deviation | 42.41 | 715.31 |
| Min | 1073 | 43846 |
Sign up as Freemium to get more insight.