c6i.12xlarge by Amazon Web Services
Geekbench is a cross-platform processor benchmark with a scoring system that determines single-core and multi-core performance using loads simulating real-world scenarios. Geekbench 5 score is calculated with a reference score of 2500 representing the performance of the Intel Core i5-2520M @ 2.50 GHz. The software benchmark is available for Mac OS, Windows, Linux, Android and iOS platforms.
Specifications:
CPU
48
RAM
96.0 GB
Net
18750 Mbps
{
"configuration": {
"chart": {
"type": "scatter",
"polar": false,
"zoomType": "",
"options3d": {},
"height": null,
"width": null,
"margin": null,
"inverted": false,
"zooming": {}
},
"credits": {
"enabled": false
},
"title": {
"text": ""
},
"colorAxis": null,
"subtitle": {
"text": ""
},
"xAxis": {
"title": {
"text": [
"Single Score"
],
"useHTML": false,
"style": {
"color": "#666666"
}
},
"categories": null,
"lineWidth": 1,
"tickInterval": null,
"tickWidth": 1,
"tickLength": 10,
"tickPixelInterval": 100,
"plotLines": null,
"labels": {
"enabled": true,
"format": null,
"formatter": "",
"style": {
"color": "#666666",
"cursor": "default",
"fontSize": "11px"
},
"useHTML": false,
"step": 0
},
"plotBands": null,
"visible": true,
"floor": null,
"ceiling": null,
"type": "linear",
"min": 0,
"gridLineWidth": 1,
"gridLineColor": "#e6e6e6",
"minorTickInterval": null,
"minorTickWidth": 0,
"minTickInterval": null,
"startOnTick": true,
"endOnTick": true,
"tickmarkPlacement": 100,
"units": 100,
"minRange": 100
},
"yAxis": {
"title": {
"text": [
"Multi Score"
],
"useHTML": false,
"style": {
"color": "#666666"
}
},
"categories": null,
"plotLines": null,
"plotBands": null,
"lineWidth": null,
"tickInterval": null,
"tickLength": 10,
"floor": null,
"ceiling": null,
"gridLineInterpolation": null,
"gridLineWidth": 1,
"gridLineColor": "#e6e6e6",
"min": 0,
"max": null,
"minorTickInterval": null,
"minorTickWidth": 0,
"minTickInterval": null,
"startOnTick": true,
"endOnTick": true,
"minRange": null,
"type": "linear",
"tickmarkPlacement": null,
"labels": {
"enabled": true,
"formatter": null,
"style": {
"color": "#666666",
"cursor": "default",
"fontSize": "11px"
},
"useHTML": false
}
},
"zAxis": {
"title": {
"text": "Multi Score"
}
},
"plotOptions": {
"series": {
"dataLabels": {
"enabled": false,
"format": null,
"distance": 30,
"align": "center",
"inside": null,
"allowOverlap": false,
"style": {
"fontSize": "11px"
}
},
"showInLegend": null,
"turboThreshold": 0,
"stacking": "",
"groupPadding": 0.2,
"centerInCategory": false,
"findNearestPointBy": "x"
}
},
"navigator": {
"enabled": false
},
"scrollbar": {
"enabled": false
},
"rangeSelector": {
"enabled": false,
"inputEnabled": false
},
"legend": {
"enabled": null,
"maxHeight": null,
"align": "center",
"verticalAlign": "bottom",
"layout": "horizontal",
"width": null,
"margin": 12,
"reversed": false
},
"series": [
{
"name": "c6i.12xlarge by Amazon Web Services",
"color": "#f7981d",
"data": [
{
"x": 1260.7046850086558,
"y": 25532.86101588436
},
{
"x": 1221.7360573005915,
"y": 25562.131770426284
},
{
"x": 1254.4578140618423,
"y": 25602.977444538246
},
{
"x": 1231.068487358905,
"y": 25339.544157504166
},
{
"x": 1257.4005929179389,
"y": 25629.63533654525
},
{
"x": 1232.5417718974857,
"y": 25413.38226227377
},
{
"x": 1261.1934523538325,
"y": 25658.749916404973
},
{
"x": 1209.4030610932316,
"y": 25248.48210331739
},
{
"x": 1260.8538610659236,
"y": 25620.659817934313
},
{
"x": 1232.6728746228766,
"y": 25419.97020085511
},
{
"x": 1260.0069592257503,
"y": 25672.369896602002
},
{
"x": 1216.879936918771,
"y": 25093.86067657564
},
{
"x": 1262.9749608827444,
"y": 25807.855887870508
},
{
"x": 1214.9295099839965,
"y": 25424.998638027042
},
{
"x": 1262.0855427512693,
"y": 25444.030913966984
},
{
"x": 1223.0810238646557,
"y": 25329.23720659229
},
{
"x": 1260.551958310365,
"y": 25164.35897433963
},
{
"x": 1222.982652186117,
"y": 25439.582872935527
},
{
"x": 1266.3573780790543,
"y": 25818.507148517252
},
{
"x": 1235.0289716272741,
"y": 25343.437615690655
}
]
}
],
"drilldown": {},
"tooltip": {
"enabled": true,
"useHTML": false,
"format": null,
"headerFormat": "",
"pointFormat": "<span style=\"color:{series.color}\">Single</span>: <b>{point.x:.0f}</b><br><span style=\"color:{series.color}\">Multi</span>: <b>{point.y:.0f}</b>",
"footerFormat": "",
"shared": false,
"outside": false,
"valueDecimals": null,
"split": false
},
"annotations": null
},
"hc_type": "chart",
"id": "245245253405913172117877949900340911169"
}
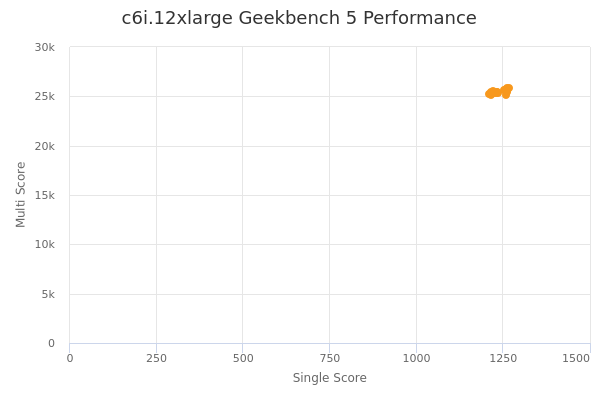
| Single | Multi | |
|---|---|---|
| Max | 1266 | 25819 |
| Average | 1242 | 25478 |
| Deviation | 19.33 | 191.74 |
| Min | 1209 | 25094 |
Sign up as Freemium to get more insight.