c6i.xlarge by Amazon Web Services
Geekbench is a cross-platform processor benchmark with a scoring system that determines single-core and multi-core performance using loads simulating real-world scenarios. Geekbench 5 score is calculated with a reference score of 2500 representing the performance of the Intel Core i5-2520M @ 2.50 GHz. The software benchmark is available for Mac OS, Windows, Linux, Android and iOS platforms.
Specifications:
CPU
4
RAM
8.0 GB
Net
12500 Mbps
{
"configuration": {
"chart": {
"type": "scatter",
"polar": false,
"zoomType": "",
"options3d": {},
"height": null,
"width": null,
"margin": null,
"inverted": false,
"zooming": {}
},
"credits": {
"enabled": false
},
"title": {
"text": ""
},
"colorAxis": null,
"subtitle": {
"text": ""
},
"xAxis": {
"title": {
"text": [
"Single Score"
],
"useHTML": false,
"style": {
"color": "#666666"
}
},
"categories": null,
"lineWidth": 1,
"tickInterval": null,
"tickWidth": 1,
"tickLength": 10,
"tickPixelInterval": 100,
"plotLines": null,
"labels": {
"enabled": true,
"format": null,
"formatter": "",
"style": {
"color": "#666666",
"cursor": "default",
"fontSize": "11px"
},
"useHTML": false,
"step": 0
},
"plotBands": null,
"visible": true,
"floor": null,
"ceiling": null,
"type": "linear",
"min": 0,
"gridLineWidth": 1,
"gridLineColor": "#e6e6e6",
"minorTickInterval": null,
"minorTickWidth": 0,
"minTickInterval": null,
"startOnTick": true,
"endOnTick": true,
"tickmarkPlacement": 100,
"units": 100,
"minRange": 100
},
"yAxis": {
"title": {
"text": [
"Multi Score"
],
"useHTML": false,
"style": {
"color": "#666666"
}
},
"categories": null,
"plotLines": null,
"plotBands": null,
"lineWidth": null,
"tickInterval": null,
"tickLength": 10,
"floor": null,
"ceiling": null,
"gridLineInterpolation": null,
"gridLineWidth": 1,
"gridLineColor": "#e6e6e6",
"min": 0,
"max": null,
"minorTickInterval": null,
"minorTickWidth": 0,
"minTickInterval": null,
"startOnTick": true,
"endOnTick": true,
"minRange": null,
"type": "linear",
"tickmarkPlacement": null,
"labels": {
"enabled": true,
"formatter": null,
"style": {
"color": "#666666",
"cursor": "default",
"fontSize": "11px"
},
"useHTML": false
}
},
"zAxis": {
"title": {
"text": "Multi Score"
}
},
"plotOptions": {
"series": {
"dataLabels": {
"enabled": false,
"format": null,
"distance": 30,
"align": "center",
"inside": null,
"allowOverlap": false,
"style": {
"fontSize": "11px"
}
},
"showInLegend": null,
"turboThreshold": 0,
"stacking": "",
"groupPadding": 0.2,
"centerInCategory": false,
"findNearestPointBy": "x"
}
},
"navigator": {
"enabled": false
},
"scrollbar": {
"enabled": false
},
"rangeSelector": {
"enabled": false,
"inputEnabled": false
},
"legend": {
"enabled": null,
"maxHeight": null,
"align": "center",
"verticalAlign": "bottom",
"layout": "horizontal",
"width": null,
"margin": 12,
"reversed": false
},
"series": [
{
"name": "c6i.xlarge by Amazon Web Services",
"color": "#f7981d",
"data": [
{
"x": 1219.5981199247817,
"y": 2791.244337109903
},
{
"x": 1205.274686837703,
"y": 2741.9102266358364
},
{
"x": 1208.2950104885292,
"y": 2771.761458305902
},
{
"x": 1231.0282964797132,
"y": 2794.694698419607
},
{
"x": 1220.3365551586026,
"y": 2807.7840699749568
},
{
"x": 1215.770078250379,
"y": 2801.5585967747347
},
{
"x": 1219.8307927666726,
"y": 2803.079127481822
},
{
"x": 1223.994622524029,
"y": 2782.5164765405625
},
{
"x": 1234.724139471688,
"y": 2802.582131395541
},
{
"x": 1203.8651392728502,
"y": 2792.040771158042
},
{
"x": 1223.8832736254672,
"y": 2778.9914476891718
},
{
"x": 1218.7157888112397,
"y": 2789.2821910038037
},
{
"x": 1208.5341063180856,
"y": 2775.478359204003
},
{
"x": 1198.8667906445353,
"y": 2772.9577611124514
},
{
"x": 1227.7461388783863,
"y": 2771.5487459530173
},
{
"x": 1218.1661178227855,
"y": 2789.625562454428
},
{
"x": 1202.838816347266,
"y": 2775.4911600571104
},
{
"x": 1229.8787205210058,
"y": 2757.151332140751
},
{
"x": 1218.1742598074702,
"y": 2797.748883586431
},
{
"x": 1182.254933205366,
"y": 2799.7257181911177
},
{
"x": 1242.7681418681473,
"y": 2809.518105314288
},
{
"x": 1169.3636998428174,
"y": 2704.9490476044725
},
{
"x": 1235.0668031272276,
"y": 2811.5960796732047
},
{
"x": 1167.2917764983335,
"y": 2703.6911460303463
},
{
"x": 1234.8329799442506,
"y": 2811.9700975807773
},
{
"x": 1176.609287009927,
"y": 2686.5925554199766
},
{
"x": 1246.8027172367485,
"y": 2810.373737816257
},
{
"x": 1130.8690580953569,
"y": 2661.569657549345
},
{
"x": 1233.7567612272248,
"y": 2794.0855045148396
},
{
"x": 1163.5623186248756,
"y": 2713.6890942188948
},
{
"x": 1229.0978854283806,
"y": 2806.4632910827013
},
{
"x": 1159.0866820071433,
"y": 2719.595906183157
},
{
"x": 1243.48364049665,
"y": 2817.2981705454226
},
{
"x": 1164.4819301906286,
"y": 2711.578331715841
},
{
"x": 1236.8806905590172,
"y": 2817.8542903694815
},
{
"x": 1166.6272481425722,
"y": 2734.9389492913488
},
{
"x": 1233.6312516960156,
"y": 2818.463641499746
},
{
"x": 1178.9096735418461,
"y": 2737.1802555577256
},
{
"x": 1230.9729674505772,
"y": 2820.4113739993772
},
{
"x": 1179.5457961316833,
"y": 2720.1031401408263
}
]
}
],
"drilldown": {},
"tooltip": {
"enabled": true,
"useHTML": false,
"format": null,
"headerFormat": "",
"pointFormat": "<span style=\"color:{series.color}\">Single</span>: <b>{point.x:.0f}</b><br><span style=\"color:{series.color}\">Multi</span>: <b>{point.y:.0f}</b>",
"footerFormat": "",
"shared": false,
"outside": false,
"valueDecimals": null,
"split": false
},
"annotations": null
},
"hc_type": "chart",
"id": "14125981719723855563363839119582012006"
}
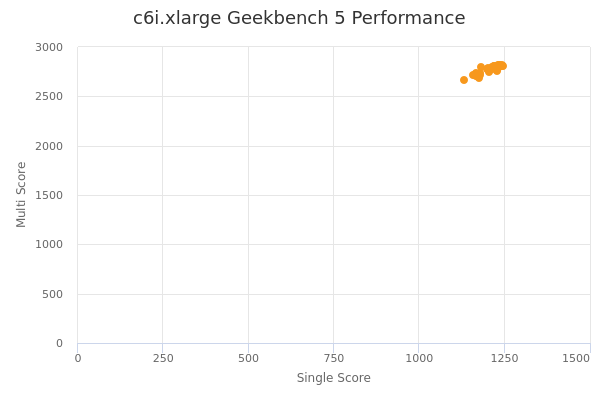
| Single | Multi | |
|---|---|---|
| Max | 1247 | 2820 |
| Average | 1208 | 2773 |
| Deviation | 28.50 | 41.47 |
| Min | 1131 | 2662 |
Sign up as Freemium to get more insight.