r6in.metal by Amazon Web Services
Geekbench is a cross-platform processor benchmark with a scoring system that determines single-core and multi-core performance using loads simulating real-world scenarios. Geekbench 5 score is calculated with a reference score of 2500 representing the performance of the Intel Core i5-2520M @ 2.50 GHz. The software benchmark is available for Mac OS, Windows, Linux, Android and iOS platforms.
Specifications:
CPU
128
RAM
1024.0 GB
Net
200000 Mbps
{
"configuration": {
"chart": {
"type": "scatter",
"polar": false,
"zoomType": "",
"options3d": {},
"height": null,
"width": null,
"margin": null,
"inverted": false,
"zooming": {}
},
"credits": {
"enabled": false
},
"title": {
"text": ""
},
"colorAxis": null,
"subtitle": {
"text": ""
},
"xAxis": {
"title": {
"text": [
"Single Score"
],
"useHTML": false,
"style": {
"color": "#666666"
}
},
"categories": null,
"lineWidth": 1,
"tickInterval": null,
"tickWidth": 1,
"tickLength": 10,
"tickPixelInterval": 100,
"plotLines": null,
"labels": {
"enabled": true,
"format": null,
"formatter": "",
"style": {
"color": "#666666",
"cursor": "default",
"fontSize": "11px"
},
"useHTML": false,
"step": 0
},
"plotBands": null,
"visible": true,
"floor": null,
"ceiling": null,
"type": "linear",
"min": 0,
"gridLineWidth": 1,
"gridLineColor": "#e6e6e6",
"minorTickInterval": null,
"minorTickWidth": 0,
"minTickInterval": null,
"startOnTick": true,
"endOnTick": true,
"tickmarkPlacement": 100,
"units": 100,
"minRange": 100
},
"yAxis": {
"title": {
"text": [
"Multi Score"
],
"useHTML": false,
"style": {
"color": "#666666"
}
},
"categories": null,
"plotLines": null,
"plotBands": null,
"lineWidth": null,
"tickInterval": null,
"tickLength": 10,
"floor": null,
"ceiling": null,
"gridLineInterpolation": null,
"gridLineWidth": 1,
"gridLineColor": "#e6e6e6",
"min": 0,
"max": null,
"minorTickInterval": null,
"minorTickWidth": 0,
"minTickInterval": null,
"startOnTick": true,
"endOnTick": true,
"minRange": null,
"type": "linear",
"tickmarkPlacement": null,
"labels": {
"enabled": true,
"formatter": null,
"style": {
"color": "#666666",
"cursor": "default",
"fontSize": "11px"
},
"useHTML": false
}
},
"zAxis": {
"title": {
"text": "Multi Score"
}
},
"plotOptions": {
"series": {
"dataLabels": {
"enabled": false,
"format": null,
"distance": 30,
"align": "center",
"inside": null,
"allowOverlap": false,
"style": {
"fontSize": "11px"
}
},
"showInLegend": null,
"turboThreshold": 0,
"stacking": "",
"groupPadding": 0.2,
"centerInCategory": false,
"findNearestPointBy": "x"
}
},
"navigator": {
"enabled": false
},
"scrollbar": {
"enabled": false
},
"rangeSelector": {
"enabled": false,
"inputEnabled": false
},
"legend": {
"enabled": null,
"maxHeight": null,
"align": "center",
"verticalAlign": "bottom",
"layout": "horizontal",
"width": null,
"margin": 12,
"reversed": false
},
"series": [
{
"name": "r6in.metal by Amazon Web Services",
"color": "#f7981d",
"data": [
{
"x": 1270.0435476741795,
"y": 53413.98087169869
},
{
"x": 1270.1737651111284,
"y": 52952.15334425313
},
{
"x": 1265.5520295357278,
"y": 52102.976646599374
},
{
"x": 1271.914675830752,
"y": 52631.6983485566
},
{
"x": 1275.014978206623,
"y": 52977.51381220497
},
{
"x": 1264.3317576770974,
"y": 52896.00622354173
},
{
"x": 1271.872837649478,
"y": 52170.12735026855
},
{
"x": 1265.7623631918254,
"y": 51167.178711223736
},
{
"x": 1271.6522278574478,
"y": 52174.31724986399
},
{
"x": 1264.579640929072,
"y": 53054.183409001664
},
{
"x": 1272.7278170900995,
"y": 52156.820928751855
},
{
"x": 1264.4625995520698,
"y": 53627.44885917778
},
{
"x": 1265.9288429514854,
"y": 51175.81676471686
},
{
"x": 1264.0917575331955,
"y": 53131.54449681606
},
{
"x": 1264.8207402892112,
"y": 53166.367827358976
},
{
"x": 1262.3021702174906,
"y": 52309.5062682721
},
{
"x": 1271.7916834466043,
"y": 52598.66863298672
},
{
"x": 1264.175561864587,
"y": 53167.10882787053
},
{
"x": 1266.408036060543,
"y": 52380.62054855652
},
{
"x": 1266.239465158531,
"y": 52679.16120682718
}
]
}
],
"drilldown": {},
"tooltip": {
"enabled": true,
"useHTML": false,
"format": null,
"headerFormat": "",
"pointFormat": "<span style=\"color:{series.color}\">Single</span>: <b>{point.x:.0f}</b><br><span style=\"color:{series.color}\">Multi</span>: <b>{point.y:.0f}</b>",
"footerFormat": "",
"shared": false,
"outside": false,
"valueDecimals": null,
"split": false
},
"annotations": null
},
"hc_type": "chart",
"id": "154936479778376257425822635366749205963"
}
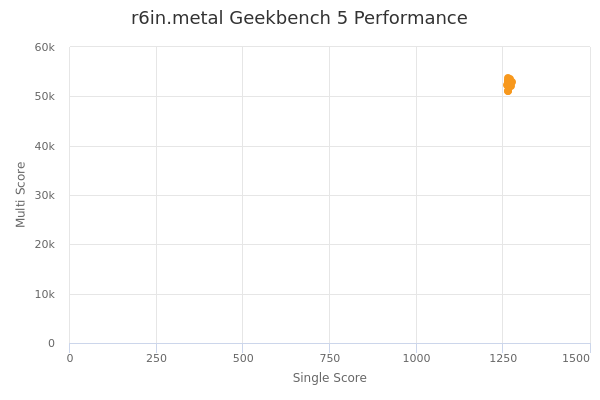
| Single | Multi | |
|---|---|---|
| Max | 1275 | 53627 |
| Average | 1268 | 52597 |
| Deviation | 3.66 | 641.63 |
| Min | 1262 | 51167 |
Sign up as Freemium to get more insight.