r6in.2xlarge by Amazon Web Services
Geekbench is a cross-platform processor benchmark with a scoring system that determines single-core and multi-core performance using loads simulating real-world scenarios. Geekbench 5 score is calculated with a reference score of 2500 representing the performance of the Intel Core i5-2520M @ 2.50 GHz. The software benchmark is available for Mac OS, Windows, Linux, Android and iOS platforms.
Specifications:
CPU
8
RAM
64.0 GB
Net
40000 Mbps
{
"configuration": {
"chart": {
"type": "scatter",
"polar": false,
"zoomType": "",
"options3d": {},
"height": null,
"width": null,
"margin": null,
"inverted": false,
"zooming": {}
},
"credits": {
"enabled": false
},
"title": {
"text": ""
},
"colorAxis": null,
"subtitle": {
"text": ""
},
"xAxis": {
"title": {
"text": [
"Single Score"
],
"useHTML": false,
"style": {
"color": "#666666"
}
},
"categories": null,
"lineWidth": 1,
"tickInterval": null,
"tickWidth": 1,
"tickLength": 10,
"tickPixelInterval": 100,
"plotLines": null,
"labels": {
"enabled": true,
"format": null,
"formatter": "",
"style": {
"color": "#666666",
"cursor": "default",
"fontSize": "11px"
},
"useHTML": false,
"step": 0
},
"plotBands": null,
"visible": true,
"floor": null,
"ceiling": null,
"type": "linear",
"min": 0,
"gridLineWidth": 1,
"gridLineColor": "#e6e6e6",
"minorTickInterval": null,
"minorTickWidth": 0,
"minTickInterval": null,
"startOnTick": true,
"endOnTick": true,
"tickmarkPlacement": 100,
"units": 100,
"minRange": 100
},
"yAxis": {
"title": {
"text": [
"Multi Score"
],
"useHTML": false,
"style": {
"color": "#666666"
}
},
"categories": null,
"plotLines": null,
"plotBands": null,
"lineWidth": null,
"tickInterval": null,
"tickLength": 10,
"floor": null,
"ceiling": null,
"gridLineInterpolation": null,
"gridLineWidth": 1,
"gridLineColor": "#e6e6e6",
"min": 0,
"max": null,
"minorTickInterval": null,
"minorTickWidth": 0,
"minTickInterval": null,
"startOnTick": true,
"endOnTick": true,
"minRange": null,
"type": "linear",
"tickmarkPlacement": null,
"labels": {
"enabled": true,
"formatter": null,
"style": {
"color": "#666666",
"cursor": "default",
"fontSize": "11px"
},
"useHTML": false
}
},
"zAxis": {
"title": {
"text": "Multi Score"
}
},
"plotOptions": {
"series": {
"dataLabels": {
"enabled": false,
"format": null,
"distance": 30,
"align": "center",
"inside": null,
"allowOverlap": false,
"style": {
"fontSize": "11px"
}
},
"showInLegend": null,
"turboThreshold": 0,
"stacking": "",
"groupPadding": 0.2,
"centerInCategory": false,
"findNearestPointBy": "x"
}
},
"navigator": {
"enabled": false
},
"scrollbar": {
"enabled": false
},
"rangeSelector": {
"enabled": false,
"inputEnabled": false
},
"legend": {
"enabled": null,
"maxHeight": null,
"align": "center",
"verticalAlign": "bottom",
"layout": "horizontal",
"width": null,
"margin": 12,
"reversed": false
},
"series": [
{
"name": "r6in.2xlarge by Amazon Web Services",
"color": "#f7981d",
"data": [
{
"x": 1241.3623887204526,
"y": 5421.283615378907
},
{
"x": 1197.464434812562,
"y": 5258.452580026204
},
{
"x": 1248.0984352403593,
"y": 5419.008799068499
},
{
"x": 1164.0316127486208,
"y": 5239.8807219904
},
{
"x": 1254.5984295237085,
"y": 5411.160872294982
},
{
"x": 1184.3466877816609,
"y": 5237.4415220239625
},
{
"x": 1248.880439978182,
"y": 5419.131937681106
},
{
"x": 1155.6627073265472,
"y": 5267.763615692449
},
{
"x": 1253.954619755261,
"y": 5404.431607800491
},
{
"x": 1197.2606640426393,
"y": 5205.790283796597
},
{
"x": 1242.1678687945189,
"y": 5421.257049384296
},
{
"x": 1185.5283729322032,
"y": 5169.767441548836
},
{
"x": 1237.8207333800258,
"y": 5432.749856361322
},
{
"x": 1168.01722828438,
"y": 5203.413549714929
},
{
"x": 1245.4763210282827,
"y": 5417.52385453644
},
{
"x": 1154.200761058002,
"y": 5202.530328437688
},
{
"x": 1246.4692655567899,
"y": 5419.839103208078
},
{
"x": 1185.5737682268077,
"y": 5255.608063263815
},
{
"x": 1252.4650228038786,
"y": 5401.601997100953
},
{
"x": 1199.7596533430915,
"y": 5305.117600252315
},
{
"x": 1207.1554838316388,
"y": 5326.805360592847
},
{
"x": 1169.2381045166949,
"y": 5264.358928651729
},
{
"x": 1212.2499957464154,
"y": 5302.871305068058
},
{
"x": 1178.0613794198425,
"y": 5275.822773729989
},
{
"x": 1204.2732773585137,
"y": 5312.822348901102
},
{
"x": 1182.7474943552636,
"y": 5267.007763571524
},
{
"x": 1213.3876921975136,
"y": 5325.152460651216
},
{
"x": 1230.3103645909796,
"y": 5350.59863502563
},
{
"x": 1207.439617350571,
"y": 5345.331276338409
},
{
"x": 1170.557811593415,
"y": 5217.406490728841
},
{
"x": 1215.4847821403382,
"y": 5293.179596055796
},
{
"x": 1170.790781031607,
"y": 5204.995704530567
},
{
"x": 1207.591457985924,
"y": 5308.159223558325
},
{
"x": 1187.978827588323,
"y": 5273.855328876867
},
{
"x": 1215.8394618907587,
"y": 5312.353951082476
},
{
"x": 1201.0958802992168,
"y": 5340.16842213969
},
{
"x": 1214.557856924773,
"y": 5323.168397386156
},
{
"x": 1203.231275737881,
"y": 5259.222703202503
},
{
"x": 1203.846336138842,
"y": 5322.517774090347
},
{
"x": 1169.2379940273158,
"y": 5230.424916886579
}
]
}
],
"drilldown": {},
"tooltip": {
"enabled": true,
"useHTML": false,
"format": null,
"headerFormat": "",
"pointFormat": "<span style=\"color:{series.color}\">Single</span>: <b>{point.x:.0f}</b><br><span style=\"color:{series.color}\">Multi</span>: <b>{point.y:.0f}</b>",
"footerFormat": "",
"shared": false,
"outside": false,
"valueDecimals": null,
"split": false
},
"annotations": null
},
"hc_type": "chart",
"id": "147981041944313427727107387929033617926"
}
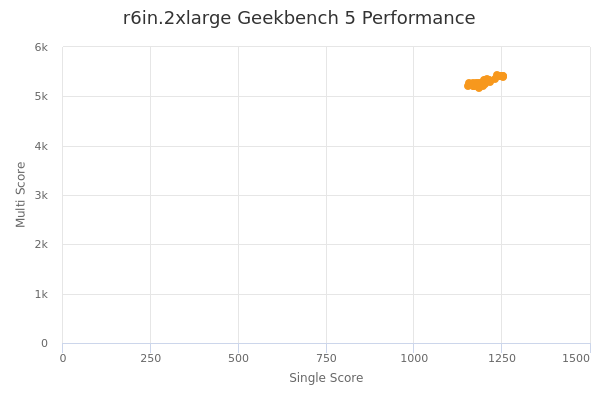
| Single | Multi | |
|---|---|---|
| Max | 1255 | 5433 |
| Average | 1206 | 5309 |
| Deviation | 29.56 | 75.12 |
| Min | 1154 | 5170 |
Sign up as Freemium to get more insight.