r6in.4xlarge by Amazon Web Services
Geekbench is a cross-platform processor benchmark with a scoring system that determines single-core and multi-core performance using loads simulating real-world scenarios. Geekbench 5 score is calculated with a reference score of 2500 representing the performance of the Intel Core i5-2520M @ 2.50 GHz. The software benchmark is available for Mac OS, Windows, Linux, Android and iOS platforms.
Specifications:
CPU
16
RAM
128.0 GB
Net
50000 Mbps
{
"configuration": {
"chart": {
"type": "scatter",
"polar": false,
"zoomType": "",
"options3d": {},
"height": null,
"width": null,
"margin": null,
"inverted": false,
"zooming": {}
},
"credits": {
"enabled": false
},
"title": {
"text": ""
},
"colorAxis": null,
"subtitle": {
"text": ""
},
"xAxis": {
"title": {
"text": [
"Single Score"
],
"useHTML": false,
"style": {
"color": "#666666"
}
},
"categories": null,
"lineWidth": 1,
"tickInterval": null,
"tickWidth": 1,
"tickLength": 10,
"tickPixelInterval": 100,
"plotLines": null,
"labels": {
"enabled": true,
"format": null,
"formatter": "",
"style": {
"color": "#666666",
"cursor": "default",
"fontSize": "11px"
},
"useHTML": false,
"step": 0
},
"plotBands": null,
"visible": true,
"floor": null,
"ceiling": null,
"type": "linear",
"min": 0,
"gridLineWidth": 1,
"gridLineColor": "#e6e6e6",
"minorTickInterval": null,
"minorTickWidth": 0,
"minTickInterval": null,
"startOnTick": true,
"endOnTick": true,
"tickmarkPlacement": 100,
"units": 100,
"minRange": 100
},
"yAxis": {
"title": {
"text": [
"Multi Score"
],
"useHTML": false,
"style": {
"color": "#666666"
}
},
"categories": null,
"plotLines": null,
"plotBands": null,
"lineWidth": null,
"tickInterval": null,
"tickLength": 10,
"floor": null,
"ceiling": null,
"gridLineInterpolation": null,
"gridLineWidth": 1,
"gridLineColor": "#e6e6e6",
"min": 0,
"max": null,
"minorTickInterval": null,
"minorTickWidth": 0,
"minTickInterval": null,
"startOnTick": true,
"endOnTick": true,
"minRange": null,
"type": "linear",
"tickmarkPlacement": null,
"labels": {
"enabled": true,
"formatter": null,
"style": {
"color": "#666666",
"cursor": "default",
"fontSize": "11px"
},
"useHTML": false
}
},
"zAxis": {
"title": {
"text": "Multi Score"
}
},
"plotOptions": {
"series": {
"dataLabels": {
"enabled": false,
"format": null,
"distance": 30,
"align": "center",
"inside": null,
"allowOverlap": false,
"style": {
"fontSize": "11px"
}
},
"showInLegend": null,
"turboThreshold": 0,
"stacking": "",
"groupPadding": 0.2,
"centerInCategory": false,
"findNearestPointBy": "x"
}
},
"navigator": {
"enabled": false
},
"scrollbar": {
"enabled": false
},
"rangeSelector": {
"enabled": false,
"inputEnabled": false
},
"legend": {
"enabled": null,
"maxHeight": null,
"align": "center",
"verticalAlign": "bottom",
"layout": "horizontal",
"width": null,
"margin": 12,
"reversed": false
},
"series": [
{
"name": "r6in.4xlarge by Amazon Web Services",
"color": "#f7981d",
"data": [
{
"x": 1192.4112977855084,
"y": 9911.700733885698
},
{
"x": 1179.0561792418616,
"y": 9859.824084356704
},
{
"x": 1193.483165921014,
"y": 9915.501479505487
},
{
"x": 1185.9709808692758,
"y": 9902.748805860825
},
{
"x": 1184.302260773859,
"y": 9887.54595704234
},
{
"x": 1205.5326109382947,
"y": 9919.992123026452
},
{
"x": 1192.4424715716377,
"y": 9976.99690612784
},
{
"x": 1190.5278959742202,
"y": 9997.75848582604
},
{
"x": 1182.9854343425136,
"y": 9975.167089986753
},
{
"x": 1168.9239547560064,
"y": 9907.83710849014
},
{
"x": 1192.1110359245167,
"y": 9960.00833465903
},
{
"x": 1193.5939982256846,
"y": 9831.575418878618
},
{
"x": 1188.4521035707785,
"y": 9916.593793854867
},
{
"x": 1190.623874403792,
"y": 9961.275684965945
},
{
"x": 1192.9784316504413,
"y": 9927.539995135608
},
{
"x": 1198.278317958496,
"y": 10024.059240115363
},
{
"x": 1189.4193566992885,
"y": 9883.129563068878
},
{
"x": 1203.193393586614,
"y": 9854.073763385612
},
{
"x": 1186.715575887657,
"y": 9967.952896038314
},
{
"x": 1184.4269543225041,
"y": 9887.774150230058
}
]
}
],
"drilldown": {},
"tooltip": {
"enabled": true,
"useHTML": false,
"format": null,
"headerFormat": "",
"pointFormat": "<span style=\"color:{series.color}\">Single</span>: <b>{point.x:.0f}</b><br><span style=\"color:{series.color}\">Multi</span>: <b>{point.y:.0f}</b>",
"footerFormat": "",
"shared": false,
"outside": false,
"valueDecimals": null,
"split": false
},
"annotations": null
},
"hc_type": "chart",
"id": "291105446806631633558977565964729192009"
}
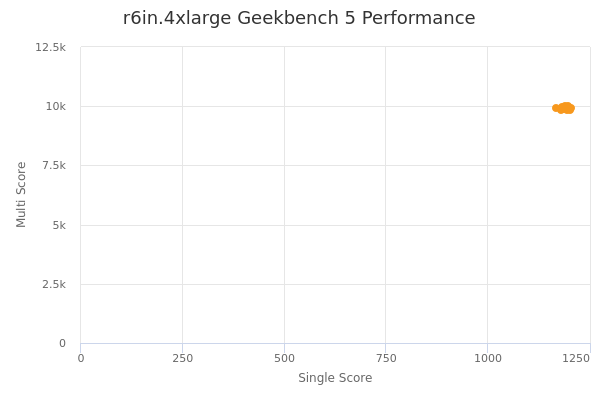
| Single | Multi | |
|---|---|---|
| Max | 1206 | 10024 |
| Average | 1190 | 9923 |
| Deviation | 7.87 | 49.18 |
| Min | 1169 | 9832 |
Sign up as Freemium to get more insight.