r6in.32xlarge by Amazon Web Services
Geekbench is a cross-platform processor benchmark with a scoring system that determines single-core and multi-core performance using loads simulating real-world scenarios. Geekbench 5 score is calculated with a reference score of 2500 representing the performance of the Intel Core i5-2520M @ 2.50 GHz. The software benchmark is available for Mac OS, Windows, Linux, Android and iOS platforms.
Specifications:
CPU
128
RAM
1024.0 GB
Net
200000 Mbps
{
"configuration": {
"chart": {
"type": "scatter",
"polar": false,
"zoomType": "",
"options3d": {},
"height": null,
"width": null,
"margin": null,
"inverted": false,
"zooming": {}
},
"credits": {
"enabled": false
},
"title": {
"text": ""
},
"colorAxis": null,
"subtitle": {
"text": ""
},
"xAxis": {
"title": {
"text": [
"Single Score"
],
"useHTML": false,
"style": {
"color": "#666666"
}
},
"categories": null,
"lineWidth": 1,
"tickInterval": null,
"tickWidth": 1,
"tickLength": 10,
"tickPixelInterval": 100,
"plotLines": null,
"labels": {
"enabled": true,
"format": null,
"formatter": "",
"style": {
"color": "#666666",
"cursor": "default",
"fontSize": "11px"
},
"useHTML": false,
"step": 0
},
"plotBands": null,
"visible": true,
"floor": null,
"ceiling": null,
"type": "linear",
"min": 0,
"gridLineWidth": 1,
"gridLineColor": "#e6e6e6",
"minorTickInterval": null,
"minorTickWidth": 0,
"minTickInterval": null,
"startOnTick": true,
"endOnTick": true,
"tickmarkPlacement": 100,
"units": 100,
"minRange": 100
},
"yAxis": {
"title": {
"text": [
"Multi Score"
],
"useHTML": false,
"style": {
"color": "#666666"
}
},
"categories": null,
"plotLines": null,
"plotBands": null,
"lineWidth": null,
"tickInterval": null,
"tickLength": 10,
"floor": null,
"ceiling": null,
"gridLineInterpolation": null,
"gridLineWidth": 1,
"gridLineColor": "#e6e6e6",
"min": 0,
"max": null,
"minorTickInterval": null,
"minorTickWidth": 0,
"minTickInterval": null,
"startOnTick": true,
"endOnTick": true,
"minRange": null,
"type": "linear",
"tickmarkPlacement": null,
"labels": {
"enabled": true,
"formatter": null,
"style": {
"color": "#666666",
"cursor": "default",
"fontSize": "11px"
},
"useHTML": false
}
},
"zAxis": {
"title": {
"text": "Multi Score"
}
},
"plotOptions": {
"series": {
"dataLabels": {
"enabled": false,
"format": null,
"distance": 30,
"align": "center",
"inside": null,
"allowOverlap": false,
"style": {
"fontSize": "11px"
}
},
"showInLegend": null,
"turboThreshold": 0,
"stacking": "",
"groupPadding": 0.2,
"centerInCategory": false,
"findNearestPointBy": "x"
}
},
"navigator": {
"enabled": false
},
"scrollbar": {
"enabled": false
},
"rangeSelector": {
"enabled": false,
"inputEnabled": false
},
"legend": {
"enabled": null,
"maxHeight": null,
"align": "center",
"verticalAlign": "bottom",
"layout": "horizontal",
"width": null,
"margin": 12,
"reversed": false
},
"series": [
{
"name": "r6in.32xlarge by Amazon Web Services",
"color": "#f7981d",
"data": [
{
"x": 1262.4628583148503,
"y": 52689.21660244821
},
{
"x": 1247.959274402395,
"y": 51474.15037378559
},
{
"x": 1247.4324527055214,
"y": 51607.88252434746
},
{
"x": 1262.977507406224,
"y": 52724.00885641663
},
{
"x": 1246.2292339333255,
"y": 52201.12431097869
},
{
"x": 1263.6196550546586,
"y": 53275.207639456305
},
{
"x": 1246.5710129352656,
"y": 51852.79895745381
},
{
"x": 1261.1506550409617,
"y": 52914.77089361722
},
{
"x": 1262.713267683957,
"y": 52019.721957237925
},
{
"x": 1246.435935231896,
"y": 52697.29833429227
},
{
"x": 1259.5960486132644,
"y": 51832.15847368135
},
{
"x": 1246.292862973408,
"y": 52076.55900186438
},
{
"x": 1258.9297040780484,
"y": 52349.25581369701
},
{
"x": 1248.0844738600676,
"y": 51849.9252887124
},
{
"x": 1244.4318570824912,
"y": 51424.67282983358
},
{
"x": 1261.1126096022003,
"y": 52518.58217255932
},
{
"x": 1245.907336923661,
"y": 51305.56124617796
},
{
"x": 1258.9333355143772,
"y": 52050.34709672762
},
{
"x": 1260.6545820362755,
"y": 52120.60390419891
},
{
"x": 1247.3414577296478,
"y": 53343.857334636086
}
]
}
],
"drilldown": {},
"tooltip": {
"enabled": true,
"useHTML": false,
"format": null,
"headerFormat": "",
"pointFormat": "<span style=\"color:{series.color}\">Single</span>: <b>{point.x:.0f}</b><br><span style=\"color:{series.color}\">Multi</span>: <b>{point.y:.0f}</b>",
"footerFormat": "",
"shared": false,
"outside": false,
"valueDecimals": null,
"split": false
},
"annotations": null
},
"hc_type": "chart",
"id": "129492691812937901152114474211148273830"
}
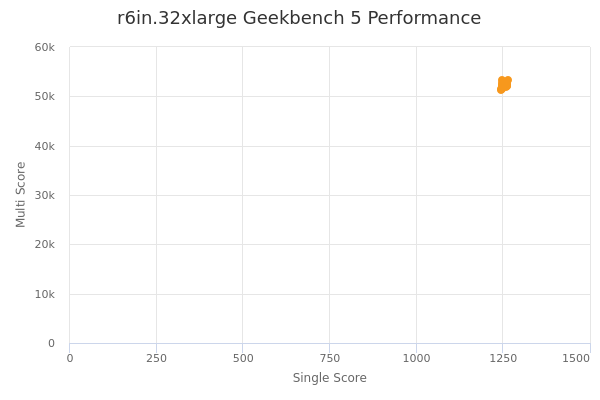
| Single | Multi | |
|---|---|---|
| Max | 1264 | 53344 |
| Average | 1254 | 52216 |
| Deviation | 7.40 | 573.95 |
| Min | 1244 | 51306 |
Sign up as Freemium to get more insight.