r6in.8xlarge by Amazon Web Services
Geekbench is a cross-platform processor benchmark with a scoring system that determines single-core and multi-core performance using loads simulating real-world scenarios. Geekbench 5 score is calculated with a reference score of 2500 representing the performance of the Intel Core i5-2520M @ 2.50 GHz. The software benchmark is available for Mac OS, Windows, Linux, Android and iOS platforms.
Specifications:
CPU
32
RAM
256.0 GB
Net
50000 Mbps
{
"configuration": {
"chart": {
"type": "scatter",
"polar": false,
"zoomType": "",
"options3d": {},
"height": null,
"width": null,
"margin": null,
"inverted": false,
"zooming": {}
},
"credits": {
"enabled": false
},
"title": {
"text": ""
},
"colorAxis": null,
"subtitle": {
"text": ""
},
"xAxis": {
"title": {
"text": [
"Single Score"
],
"useHTML": false,
"style": {
"color": "#666666"
}
},
"categories": null,
"lineWidth": 1,
"tickInterval": null,
"tickWidth": 1,
"tickLength": 10,
"tickPixelInterval": 100,
"plotLines": null,
"labels": {
"enabled": true,
"format": null,
"formatter": "",
"style": {
"color": "#666666",
"cursor": "default",
"fontSize": "11px"
},
"useHTML": false,
"step": 0
},
"plotBands": null,
"visible": true,
"floor": null,
"ceiling": null,
"type": "linear",
"min": 0,
"gridLineWidth": 1,
"gridLineColor": "#e6e6e6",
"minorTickInterval": null,
"minorTickWidth": 0,
"minTickInterval": null,
"startOnTick": true,
"endOnTick": true,
"tickmarkPlacement": 100,
"units": 100,
"minRange": 100
},
"yAxis": {
"title": {
"text": [
"Multi Score"
],
"useHTML": false,
"style": {
"color": "#666666"
}
},
"categories": null,
"plotLines": null,
"plotBands": null,
"lineWidth": null,
"tickInterval": null,
"tickLength": 10,
"floor": null,
"ceiling": null,
"gridLineInterpolation": null,
"gridLineWidth": 1,
"gridLineColor": "#e6e6e6",
"min": 0,
"max": null,
"minorTickInterval": null,
"minorTickWidth": 0,
"minTickInterval": null,
"startOnTick": true,
"endOnTick": true,
"minRange": null,
"type": "linear",
"tickmarkPlacement": null,
"labels": {
"enabled": true,
"formatter": null,
"style": {
"color": "#666666",
"cursor": "default",
"fontSize": "11px"
},
"useHTML": false
}
},
"zAxis": {
"title": {
"text": "Multi Score"
}
},
"plotOptions": {
"series": {
"dataLabels": {
"enabled": false,
"format": null,
"distance": 30,
"align": "center",
"inside": null,
"allowOverlap": false,
"style": {
"fontSize": "11px"
}
},
"showInLegend": null,
"turboThreshold": 0,
"stacking": "",
"groupPadding": 0.2,
"centerInCategory": false,
"findNearestPointBy": "x"
}
},
"navigator": {
"enabled": false
},
"scrollbar": {
"enabled": false
},
"rangeSelector": {
"enabled": false,
"inputEnabled": false
},
"legend": {
"enabled": null,
"maxHeight": null,
"align": "center",
"verticalAlign": "bottom",
"layout": "horizontal",
"width": null,
"margin": 12,
"reversed": false
},
"series": [
{
"name": "r6in.8xlarge by Amazon Web Services",
"color": "#f7981d",
"data": [
{
"x": 1267.5071764131515,
"y": 18387.73151898737
},
{
"x": 1250.2810514386322,
"y": 18425.042791554963
},
{
"x": 1270.359404178144,
"y": 18384.75008527371
},
{
"x": 1261.3095921598988,
"y": 18520.077187830128
},
{
"x": 1270.6346699791611,
"y": 18441.574539110232
},
{
"x": 1272.5166456532943,
"y": 18480.426664668925
},
{
"x": 1261.867026433983,
"y": 18441.559306469753
},
{
"x": 1256.7168694107331,
"y": 18504.322085938897
},
{
"x": 1262.7229988918987,
"y": 18362.725190756755
},
{
"x": 1255.8560821231572,
"y": 18362.112424745344
},
{
"x": 1275.162446641984,
"y": 18496.115154378313
},
{
"x": 1255.362436767017,
"y": 18406.41082932587
},
{
"x": 1274.7047426511458,
"y": 18494.02961433443
},
{
"x": 1255.5785068625896,
"y": 18395.2701118567
},
{
"x": 1275.9855407128966,
"y": 18445.545939982974
},
{
"x": 1256.3798318798674,
"y": 18436.907774565014
},
{
"x": 1273.2592528937528,
"y": 18509.981669150104
},
{
"x": 1269.895186018822,
"y": 18487.383746442112
},
{
"x": 1276.8240731810283,
"y": 18499.639759960264
},
{
"x": 1270.9056528179854,
"y": 18255.403782574183
}
]
}
],
"drilldown": {},
"tooltip": {
"enabled": true,
"useHTML": false,
"format": null,
"headerFormat": "",
"pointFormat": "<span style=\"color:{series.color}\">Single</span>: <b>{point.x:.0f}</b><br><span style=\"color:{series.color}\">Multi</span>: <b>{point.y:.0f}</b>",
"footerFormat": "",
"shared": false,
"outside": false,
"valueDecimals": null,
"split": false
},
"annotations": null
},
"hc_type": "chart",
"id": "11856038614117103007312268270337913073"
}
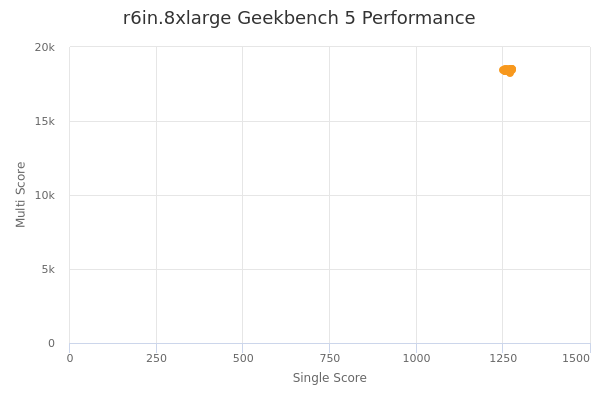
| Single | Multi | |
|---|---|---|
| Max | 1277 | 18520 |
| Average | 1266 | 18437 |
| Deviation | 8.22 | 64.83 |
| Min | 1250 | 18255 |
Sign up as Freemium to get more insight.