r5a.large by Amazon Web Services
Geekbench is a cross-platform processor benchmark with a scoring system that determines single-core and multi-core performance using loads simulating real-world scenarios. Geekbench 5 score is calculated with a reference score of 2500 representing the performance of the Intel Core i5-2520M @ 2.50 GHz. The software benchmark is available for Mac OS, Windows, Linux, Android and iOS platforms.
Specifications:
CPU
2
RAM
16.0 GB
Net
10000 Mbps
{
"configuration": {
"chart": {
"type": "scatter",
"polar": false,
"zoomType": "",
"options3d": {},
"height": null,
"width": null,
"margin": null,
"inverted": false,
"zooming": {}
},
"credits": {
"enabled": false
},
"title": {
"text": ""
},
"colorAxis": null,
"subtitle": {
"text": ""
},
"xAxis": {
"title": {
"text": [
"Single Score"
],
"useHTML": false,
"style": {
"color": "#666666"
}
},
"categories": null,
"lineWidth": 1,
"tickInterval": null,
"tickWidth": 1,
"tickLength": 10,
"tickPixelInterval": 100,
"plotLines": null,
"labels": {
"enabled": true,
"format": null,
"formatter": "",
"style": {
"color": "#666666",
"cursor": "default",
"fontSize": "11px"
},
"useHTML": false,
"step": 0
},
"plotBands": null,
"visible": true,
"floor": null,
"ceiling": null,
"type": "linear",
"min": 0,
"gridLineWidth": 1,
"gridLineColor": "#e6e6e6",
"minorTickInterval": null,
"minorTickWidth": 0,
"minTickInterval": null,
"startOnTick": true,
"endOnTick": true,
"tickmarkPlacement": 100,
"units": 100,
"minRange": 100
},
"yAxis": {
"title": {
"text": [
"Multi Score"
],
"useHTML": false,
"style": {
"color": "#666666"
}
},
"categories": null,
"plotLines": null,
"plotBands": null,
"lineWidth": null,
"tickInterval": null,
"tickLength": 10,
"floor": null,
"ceiling": null,
"gridLineInterpolation": null,
"gridLineWidth": 1,
"gridLineColor": "#e6e6e6",
"min": 0,
"max": null,
"minorTickInterval": null,
"minorTickWidth": 0,
"minTickInterval": null,
"startOnTick": true,
"endOnTick": true,
"minRange": null,
"type": "linear",
"tickmarkPlacement": null,
"labels": {
"enabled": true,
"formatter": null,
"style": {
"color": "#666666",
"cursor": "default",
"fontSize": "11px"
},
"useHTML": false
}
},
"zAxis": {
"title": {
"text": "Multi Score"
}
},
"plotOptions": {
"series": {
"dataLabels": {
"enabled": false,
"format": null,
"distance": 30,
"align": "center",
"inside": null,
"allowOverlap": false,
"style": {
"fontSize": "11px"
}
},
"showInLegend": null,
"turboThreshold": 0,
"stacking": "",
"groupPadding": 0.2,
"centerInCategory": false,
"findNearestPointBy": "x"
}
},
"navigator": {
"enabled": false
},
"scrollbar": {
"enabled": false
},
"rangeSelector": {
"enabled": false,
"inputEnabled": false
},
"legend": {
"enabled": null,
"maxHeight": null,
"align": "center",
"verticalAlign": "bottom",
"layout": "horizontal",
"width": null,
"margin": 12,
"reversed": false
},
"series": [
{
"name": "r5a.large by Amazon Web Services",
"color": "#f7981d",
"data": [
{
"x": 701.7505632001024,
"y": 900.6297282100023
},
{
"x": 693.1873712590861,
"y": 883.6659535601414
},
{
"x": 702.5046656951023,
"y": 898.7235483296172
},
{
"x": 695.5260538096899,
"y": 877.8031745859578
},
{
"x": 692.9288600702018,
"y": 901.5108672273
},
{
"x": 689.738375899481,
"y": 880.5274524220061
},
{
"x": 703.1119149341996,
"y": 893.3687448793318
},
{
"x": 688.4781045127083,
"y": 880.4639422680702
},
{
"x": 707.5460918901736,
"y": 901.9718465457846
},
{
"x": 690.0198917775423,
"y": 891.1840612502842
},
{
"x": 709.7824760497069,
"y": 897.0701351405987
},
{
"x": 697.3076658491063,
"y": 887.5722551372711
},
{
"x": 707.0154584074548,
"y": 899.8106844010865
},
{
"x": 696.7553164773456,
"y": 883.7965617626476
},
{
"x": 707.7568114681656,
"y": 893.472924706138
},
{
"x": 693.1985490036194,
"y": 879.9369610198892
},
{
"x": 707.4611225327635,
"y": 897.1330293717816
},
{
"x": 694.4128948026115,
"y": 883.2183373832643
},
{
"x": 701.5193269105381,
"y": 899.8322742342776
},
{
"x": 686.3141158922507,
"y": 888.7717237726622
}
]
}
],
"drilldown": {},
"tooltip": {
"enabled": true,
"useHTML": false,
"format": null,
"headerFormat": "",
"pointFormat": "<span style=\"color:{series.color}\">Single</span>: <b>{point.x:.0f}</b><br><span style=\"color:{series.color}\">Multi</span>: <b>{point.y:.0f}</b>",
"footerFormat": "",
"shared": false,
"outside": false,
"valueDecimals": null,
"split": false
},
"annotations": null
},
"hc_type": "chart",
"id": "180982458756101915276139036987268582586"
}
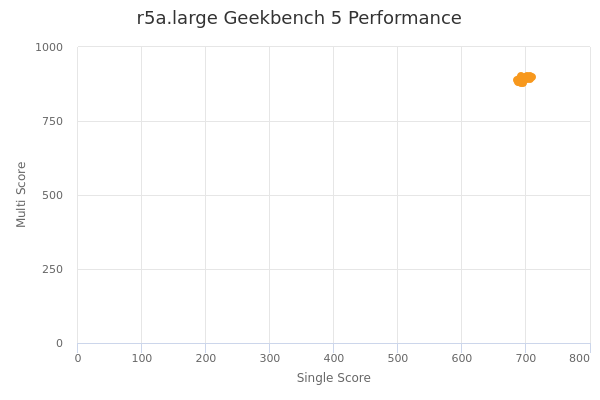
| Single | Multi | |
|---|---|---|
| Max | 710 | 902 |
| Average | 698 | 891 |
| Deviation | 7.14 | 8.14 |
| Min | 686 | 878 |
Sign up as Freemium to get more insight.
- In same series
- r5a.large
- r5a.xlarge
- r5a.2xlarge
- r5a.4xlarge
- r5a.8xlarge
- r5a.12xlarge
- r5a.16xlarge
- r5a.24xlarge