r5a.8xlarge by Amazon Web Services
Geekbench is a cross-platform processor benchmark with a scoring system that determines single-core and multi-core performance using loads simulating real-world scenarios. Geekbench 5 score is calculated with a reference score of 2500 representing the performance of the Intel Core i5-2520M @ 2.50 GHz. The software benchmark is available for Mac OS, Windows, Linux, Android and iOS platforms.
Specifications:
CPU
32
RAM
256.0 GB
Net
10000 Mbps
{
"configuration": {
"chart": {
"type": "scatter",
"polar": false,
"zoomType": "",
"options3d": {},
"height": null,
"width": null,
"margin": null,
"inverted": false,
"zooming": {}
},
"credits": {
"enabled": false
},
"title": {
"text": ""
},
"colorAxis": null,
"subtitle": {
"text": ""
},
"xAxis": {
"title": {
"text": [
"Single Score"
],
"useHTML": false,
"style": {
"color": "#666666"
}
},
"categories": null,
"lineWidth": 1,
"tickInterval": null,
"tickWidth": 1,
"tickLength": 10,
"tickPixelInterval": 100,
"plotLines": null,
"labels": {
"enabled": true,
"format": null,
"formatter": "",
"style": {
"color": "#666666",
"cursor": "default",
"fontSize": "11px"
},
"useHTML": false,
"step": 0
},
"plotBands": null,
"visible": true,
"floor": null,
"ceiling": null,
"type": "linear",
"min": 0,
"gridLineWidth": 1,
"gridLineColor": "#e6e6e6",
"minorTickInterval": null,
"minorTickWidth": 0,
"minTickInterval": null,
"startOnTick": true,
"endOnTick": true,
"tickmarkPlacement": 100,
"units": 100,
"minRange": 100
},
"yAxis": {
"title": {
"text": [
"Multi Score"
],
"useHTML": false,
"style": {
"color": "#666666"
}
},
"categories": null,
"plotLines": null,
"plotBands": null,
"lineWidth": null,
"tickInterval": null,
"tickLength": 10,
"floor": null,
"ceiling": null,
"gridLineInterpolation": null,
"gridLineWidth": 1,
"gridLineColor": "#e6e6e6",
"min": 0,
"max": null,
"minorTickInterval": null,
"minorTickWidth": 0,
"minTickInterval": null,
"startOnTick": true,
"endOnTick": true,
"minRange": null,
"type": "linear",
"tickmarkPlacement": null,
"labels": {
"enabled": true,
"formatter": null,
"style": {
"color": "#666666",
"cursor": "default",
"fontSize": "11px"
},
"useHTML": false
}
},
"zAxis": {
"title": {
"text": "Multi Score"
}
},
"plotOptions": {
"series": {
"dataLabels": {
"enabled": false,
"format": null,
"distance": 30,
"align": "center",
"inside": null,
"allowOverlap": false,
"style": {
"fontSize": "11px"
}
},
"showInLegend": null,
"turboThreshold": 0,
"stacking": "",
"groupPadding": 0.2,
"centerInCategory": false,
"findNearestPointBy": "x"
}
},
"navigator": {
"enabled": false
},
"scrollbar": {
"enabled": false
},
"rangeSelector": {
"enabled": false,
"inputEnabled": false
},
"legend": {
"enabled": null,
"maxHeight": null,
"align": "center",
"verticalAlign": "bottom",
"layout": "horizontal",
"width": null,
"margin": 12,
"reversed": false
},
"series": [
{
"name": "r5a.8xlarge by Amazon Web Services",
"color": "#f7981d",
"data": [
{
"x": 635.401933154235,
"y": 9263.182531525283
},
{
"x": 631.2655545079474,
"y": 9479.530788385917
},
{
"x": 630.0899537220613,
"y": 9269.299186317241
},
{
"x": 631.0430625692452,
"y": 9364.029363174168
},
{
"x": 630.4735985992119,
"y": 9482.710155472996
},
{
"x": 631.697589525162,
"y": 9306.461384719783
},
{
"x": 630.6041922842446,
"y": 9410.340910932024
},
{
"x": 630.1910685564328,
"y": 9198.431961447617
},
{
"x": 630.2156945225936,
"y": 9475.160002244544
},
{
"x": 632.448254039688,
"y": 9335.609955597503
},
{
"x": 629.848752890494,
"y": 9582.894540960622
},
{
"x": 631.1444002768162,
"y": 9400.327843131616
},
{
"x": 630.4117588668935,
"y": 9362.120568017363
},
{
"x": 630.98944294722,
"y": 9402.682089373055
},
{
"x": 632.3803485261312,
"y": 9360.039387336648
},
{
"x": 630.5847119209284,
"y": 9571.874836154033
},
{
"x": 630.3594405200269,
"y": 9387.122615997247
},
{
"x": 631.5834160677975,
"y": 9212.025864716037
},
{
"x": 630.7649493788094,
"y": 9339.105879178902
},
{
"x": 631.3972123608017,
"y": 9367.063328165961
}
]
}
],
"drilldown": {},
"tooltip": {
"enabled": true,
"useHTML": false,
"format": null,
"headerFormat": "",
"pointFormat": "<span style=\"color:{series.color}\">Single</span>: <b>{point.x:.0f}</b><br><span style=\"color:{series.color}\">Multi</span>: <b>{point.y:.0f}</b>",
"footerFormat": "",
"shared": false,
"outside": false,
"valueDecimals": null,
"split": false
},
"annotations": null
},
"hc_type": "chart",
"id": "244555238174931981203069643333806269936"
}
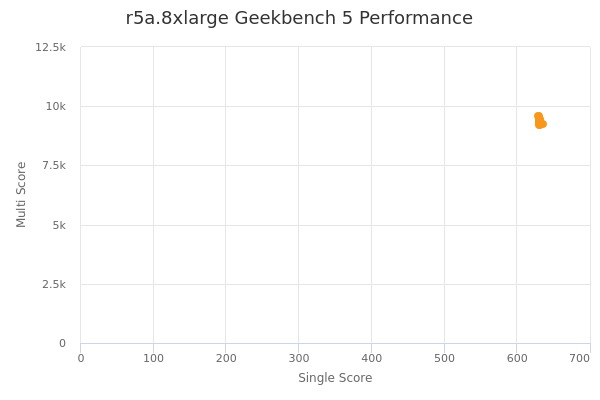
| Single | Multi | |
|---|---|---|
| Max | 635 | 9583 |
| Average | 631 | 9379 |
| Deviation | 1.20 | 101.64 |
| Min | 630 | 9198 |
Sign up as Freemium to get more insight.
- In same series
- r5a.large
- r5a.xlarge
- r5a.2xlarge
- r5a.4xlarge
- r5a.8xlarge
- r5a.12xlarge
- r5a.16xlarge
- r5a.24xlarge