r5a.xlarge by Amazon Web Services
Geekbench is a cross-platform processor benchmark with a scoring system that determines single-core and multi-core performance using loads simulating real-world scenarios. Geekbench 5 score is calculated with a reference score of 2500 representing the performance of the Intel Core i5-2520M @ 2.50 GHz. The software benchmark is available for Mac OS, Windows, Linux, Android and iOS platforms.
Specifications:
CPU
4
RAM
32.0 GB
Net
10000 Mbps
{
"configuration": {
"chart": {
"type": "scatter",
"polar": false,
"zoomType": "",
"options3d": {},
"height": null,
"width": null,
"margin": null,
"inverted": false,
"zooming": {}
},
"credits": {
"enabled": false
},
"title": {
"text": ""
},
"colorAxis": null,
"subtitle": {
"text": ""
},
"xAxis": {
"title": {
"text": [
"Single Score"
],
"useHTML": false,
"style": {
"color": "#666666"
}
},
"categories": null,
"lineWidth": 1,
"tickInterval": null,
"tickWidth": 1,
"tickLength": 10,
"tickPixelInterval": 100,
"plotLines": null,
"labels": {
"enabled": true,
"format": null,
"formatter": "",
"style": {
"color": "#666666",
"cursor": "default",
"fontSize": "11px"
},
"useHTML": false,
"step": 0
},
"plotBands": null,
"visible": true,
"floor": null,
"ceiling": null,
"type": "linear",
"min": 0,
"gridLineWidth": 1,
"gridLineColor": "#e6e6e6",
"minorTickInterval": null,
"minorTickWidth": 0,
"minTickInterval": null,
"startOnTick": true,
"endOnTick": true,
"tickmarkPlacement": 100,
"units": 100,
"minRange": 100
},
"yAxis": {
"title": {
"text": [
"Multi Score"
],
"useHTML": false,
"style": {
"color": "#666666"
}
},
"categories": null,
"plotLines": null,
"plotBands": null,
"lineWidth": null,
"tickInterval": null,
"tickLength": 10,
"floor": null,
"ceiling": null,
"gridLineInterpolation": null,
"gridLineWidth": 1,
"gridLineColor": "#e6e6e6",
"min": 0,
"max": null,
"minorTickInterval": null,
"minorTickWidth": 0,
"minTickInterval": null,
"startOnTick": true,
"endOnTick": true,
"minRange": null,
"type": "linear",
"tickmarkPlacement": null,
"labels": {
"enabled": true,
"formatter": null,
"style": {
"color": "#666666",
"cursor": "default",
"fontSize": "11px"
},
"useHTML": false
}
},
"zAxis": {
"title": {
"text": "Multi Score"
}
},
"plotOptions": {
"series": {
"dataLabels": {
"enabled": false,
"format": null,
"distance": 30,
"align": "center",
"inside": null,
"allowOverlap": false,
"style": {
"fontSize": "11px"
}
},
"showInLegend": null,
"turboThreshold": 0,
"stacking": "",
"groupPadding": 0.2,
"centerInCategory": false,
"findNearestPointBy": "x"
}
},
"navigator": {
"enabled": false
},
"scrollbar": {
"enabled": false
},
"rangeSelector": {
"enabled": false,
"inputEnabled": false
},
"legend": {
"enabled": null,
"maxHeight": null,
"align": "center",
"verticalAlign": "bottom",
"layout": "horizontal",
"width": null,
"margin": 12,
"reversed": false
},
"series": [
{
"name": "r5a.xlarge by Amazon Web Services",
"color": "#f7981d",
"data": [
{
"x": 703.1265576677557,
"y": 1705.880097046986
},
{
"x": 692.3830966556643,
"y": 1682.9853788245991
},
{
"x": 700.7263966442023,
"y": 1698.9505190651082
},
{
"x": 693.2284638197907,
"y": 1721.3540001040758
},
{
"x": 706.184252659288,
"y": 1730.239518058951
},
{
"x": 698.1677482608743,
"y": 1697.8454134153437
},
{
"x": 708.7382178938167,
"y": 1720.3544058109687
},
{
"x": 692.3745934068729,
"y": 1714.054767588227
},
{
"x": 708.6249294196446,
"y": 1700.1276539380524
},
{
"x": 692.1107811357911,
"y": 1686.1736060071967
},
{
"x": 707.0593046672225,
"y": 1728.6159554423093
},
{
"x": 691.352283361588,
"y": 1721.9074084463787
},
{
"x": 707.034213864242,
"y": 1710.1581571072006
},
{
"x": 689.4478767265332,
"y": 1698.0731761451239
},
{
"x": 712.4657297822189,
"y": 1706.735077402123
},
{
"x": 695.0652449315639,
"y": 1693.4095845757647
},
{
"x": 706.9242394217831,
"y": 1697.524600593241
},
{
"x": 694.7736004496797,
"y": 1714.4808496083724
},
{
"x": 697.9538741101128,
"y": 1702.5645468530229
},
{
"x": 694.5632866947024,
"y": 1715.054588594106
}
]
}
],
"drilldown": {},
"tooltip": {
"enabled": true,
"useHTML": false,
"format": null,
"headerFormat": "",
"pointFormat": "<span style=\"color:{series.color}\">Single</span>: <b>{point.x:.0f}</b><br><span style=\"color:{series.color}\">Multi</span>: <b>{point.y:.0f}</b>",
"footerFormat": "",
"shared": false,
"outside": false,
"valueDecimals": null,
"split": false
},
"annotations": null
},
"hc_type": "chart",
"id": "240662002687528328004912131042093268830"
}
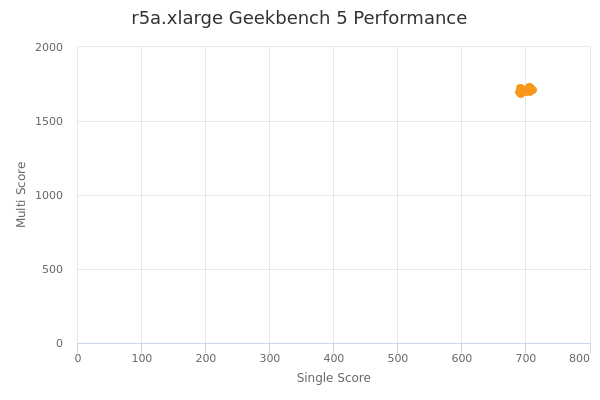
| Single | Multi | |
|---|---|---|
| Max | 712 | 1730 |
| Average | 700 | 1707 |
| Deviation | 7.06 | 12.99 |
| Min | 689 | 1683 |
Sign up as Freemium to get more insight.
- In same series
- r5a.large
- r5a.xlarge
- r5a.2xlarge
- r5a.4xlarge
- r5a.8xlarge
- r5a.12xlarge
- r5a.16xlarge
- r5a.24xlarge