r5a.2xlarge by Amazon Web Services
Geekbench is a cross-platform processor benchmark with a scoring system that determines single-core and multi-core performance using loads simulating real-world scenarios. Geekbench 5 score is calculated with a reference score of 2500 representing the performance of the Intel Core i5-2520M @ 2.50 GHz. The software benchmark is available for Mac OS, Windows, Linux, Android and iOS platforms.
Specifications:
CPU
8
RAM
64.0 GB
Net
10000 Mbps
{
"configuration": {
"chart": {
"type": "scatter",
"polar": false,
"zoomType": "",
"options3d": {},
"height": null,
"width": null,
"margin": null,
"inverted": false,
"zooming": {}
},
"credits": {
"enabled": false
},
"title": {
"text": ""
},
"colorAxis": null,
"subtitle": {
"text": ""
},
"xAxis": {
"title": {
"text": [
"Single Score"
],
"useHTML": false,
"style": {
"color": "#666666"
}
},
"categories": null,
"lineWidth": 1,
"tickInterval": null,
"tickWidth": 1,
"tickLength": 10,
"tickPixelInterval": 100,
"plotLines": null,
"labels": {
"enabled": true,
"format": null,
"formatter": "",
"style": {
"color": "#666666",
"cursor": "default",
"fontSize": "11px"
},
"useHTML": false,
"step": 0
},
"plotBands": null,
"visible": true,
"floor": null,
"ceiling": null,
"type": "linear",
"min": 0,
"gridLineWidth": 1,
"gridLineColor": "#e6e6e6",
"minorTickInterval": null,
"minorTickWidth": 0,
"minTickInterval": null,
"startOnTick": true,
"endOnTick": true,
"tickmarkPlacement": 100,
"units": 100,
"minRange": 100
},
"yAxis": {
"title": {
"text": [
"Multi Score"
],
"useHTML": false,
"style": {
"color": "#666666"
}
},
"categories": null,
"plotLines": null,
"plotBands": null,
"lineWidth": null,
"tickInterval": null,
"tickLength": 10,
"floor": null,
"ceiling": null,
"gridLineInterpolation": null,
"gridLineWidth": 1,
"gridLineColor": "#e6e6e6",
"min": 0,
"max": null,
"minorTickInterval": null,
"minorTickWidth": 0,
"minTickInterval": null,
"startOnTick": true,
"endOnTick": true,
"minRange": null,
"type": "linear",
"tickmarkPlacement": null,
"labels": {
"enabled": true,
"formatter": null,
"style": {
"color": "#666666",
"cursor": "default",
"fontSize": "11px"
},
"useHTML": false
}
},
"zAxis": {
"title": {
"text": "Multi Score"
}
},
"plotOptions": {
"series": {
"dataLabels": {
"enabled": false,
"format": null,
"distance": 30,
"align": "center",
"inside": null,
"allowOverlap": false,
"style": {
"fontSize": "11px"
}
},
"showInLegend": null,
"turboThreshold": 0,
"stacking": "",
"groupPadding": 0.2,
"centerInCategory": false,
"findNearestPointBy": "x"
}
},
"navigator": {
"enabled": false
},
"scrollbar": {
"enabled": false
},
"rangeSelector": {
"enabled": false,
"inputEnabled": false
},
"legend": {
"enabled": null,
"maxHeight": null,
"align": "center",
"verticalAlign": "bottom",
"layout": "horizontal",
"width": null,
"margin": 12,
"reversed": false
},
"series": [
{
"name": "r5a.2xlarge by Amazon Web Services",
"color": "#f7981d",
"data": [
{
"x": 719.6617334903004,
"y": 3186.8756208621435
},
{
"x": 721.0726747210908,
"y": 3173.821929034153
},
{
"x": 720.2225130306564,
"y": 3181.056629291739
},
{
"x": 719.7586121869064,
"y": 3167.3133308319984
},
{
"x": 722.5882397268829,
"y": 3186.574456386428
},
{
"x": 722.1125242629262,
"y": 3162.8469694513888
},
{
"x": 720.8437282606916,
"y": 3174.604767643372
},
{
"x": 722.7312494478181,
"y": 3165.8527445696045
},
{
"x": 721.5529191582564,
"y": 3189.0348481561914
},
{
"x": 717.6563245344801,
"y": 3170.0897702559823
},
{
"x": 721.1187657041565,
"y": 3189.5326930037886
},
{
"x": 717.71505930221,
"y": 3166.0586999381712
},
{
"x": 727.8432590368462,
"y": 3191.1551849958405
},
{
"x": 720.0796888919275,
"y": 3155.5885217554655
},
{
"x": 725.3600967282753,
"y": 3183.1804865335434
},
{
"x": 719.871828760434,
"y": 3163.028709377788
},
{
"x": 721.8446718610741,
"y": 3191.3341763518956
},
{
"x": 725.6994410472496,
"y": 3176.1417268510468
},
{
"x": 718.8241261659026,
"y": 3171.9740566417604
},
{
"x": 723.0085864139531,
"y": 3177.5234523698855
}
]
}
],
"drilldown": {},
"tooltip": {
"enabled": true,
"useHTML": false,
"format": null,
"headerFormat": "",
"pointFormat": "<span style=\"color:{series.color}\">Single</span>: <b>{point.x:.0f}</b><br><span style=\"color:{series.color}\">Multi</span>: <b>{point.y:.0f}</b>",
"footerFormat": "",
"shared": false,
"outside": false,
"valueDecimals": null,
"split": false
},
"annotations": null
},
"hc_type": "chart",
"id": "172869914323433532926326476684839082075"
}
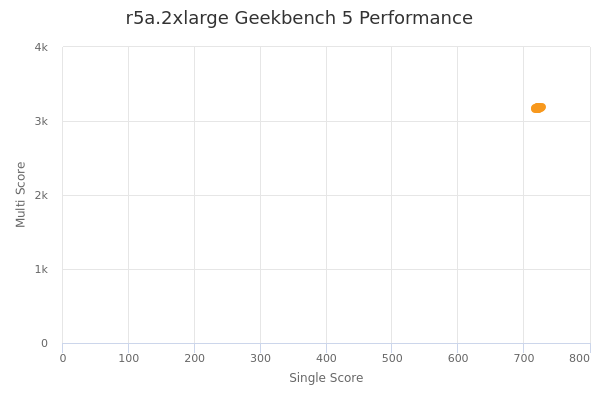
| Single | Multi | |
|---|---|---|
| Max | 728 | 3191 |
| Average | 721 | 3176 |
| Deviation | 2.53 | 10.54 |
| Min | 718 | 3156 |
Sign up as Freemium to get more insight.
- In same series
- r5a.large
- r5a.xlarge
- r5a.2xlarge
- r5a.4xlarge
- r5a.8xlarge
- r5a.12xlarge
- r5a.16xlarge
- r5a.24xlarge