m5zn.xlarge by Amazon Web Services
Geekbench is a cross-platform processor benchmark with a scoring system that determines single-core and multi-core performance using loads simulating real-world scenarios. Geekbench 5 score is calculated with a reference score of 2500 representing the performance of the Intel Core i5-2520M @ 2.50 GHz. The software benchmark is available for Mac OS, Windows, Linux, Android and iOS platforms.
Specifications:
CPU
4
RAM
16.0 GB
Net
25000 Mbps
{
"configuration": {
"chart": {
"type": "scatter",
"polar": false,
"zoomType": "",
"options3d": {},
"height": null,
"width": null,
"margin": null,
"inverted": false,
"zooming": {}
},
"credits": {
"enabled": false
},
"title": {
"text": ""
},
"colorAxis": null,
"subtitle": {
"text": ""
},
"xAxis": {
"title": {
"text": [
"Single Score"
],
"useHTML": false,
"style": {
"color": "#666666"
}
},
"categories": null,
"lineWidth": 1,
"tickInterval": null,
"tickWidth": 1,
"tickLength": 10,
"tickPixelInterval": 100,
"plotLines": null,
"labels": {
"enabled": true,
"format": null,
"formatter": "",
"style": {
"color": "#666666",
"cursor": "default",
"fontSize": "11px"
},
"useHTML": false,
"step": 0
},
"plotBands": null,
"visible": true,
"floor": null,
"ceiling": null,
"type": "linear",
"min": 0,
"gridLineWidth": 1,
"gridLineColor": "#e6e6e6",
"minorTickInterval": null,
"minorTickWidth": 0,
"minTickInterval": null,
"startOnTick": true,
"endOnTick": true,
"tickmarkPlacement": 100,
"units": 100,
"minRange": 100
},
"yAxis": {
"title": {
"text": [
"Multi Score"
],
"useHTML": false,
"style": {
"color": "#666666"
}
},
"categories": null,
"plotLines": null,
"plotBands": null,
"lineWidth": null,
"tickInterval": null,
"tickLength": 10,
"floor": null,
"ceiling": null,
"gridLineInterpolation": null,
"gridLineWidth": 1,
"gridLineColor": "#e6e6e6",
"min": 0,
"max": null,
"minorTickInterval": null,
"minorTickWidth": 0,
"minTickInterval": null,
"startOnTick": true,
"endOnTick": true,
"minRange": null,
"type": "linear",
"tickmarkPlacement": null,
"labels": {
"enabled": true,
"formatter": null,
"style": {
"color": "#666666",
"cursor": "default",
"fontSize": "11px"
},
"useHTML": false
}
},
"zAxis": {
"title": {
"text": "Multi Score"
}
},
"plotOptions": {
"series": {
"dataLabels": {
"enabled": false,
"format": null,
"distance": 30,
"align": "center",
"inside": null,
"allowOverlap": false,
"style": {
"fontSize": "11px"
}
},
"showInLegend": null,
"turboThreshold": 0,
"stacking": "",
"groupPadding": 0.2,
"centerInCategory": false,
"findNearestPointBy": "x"
}
},
"navigator": {
"enabled": false
},
"scrollbar": {
"enabled": false
},
"rangeSelector": {
"enabled": false,
"inputEnabled": false
},
"legend": {
"enabled": null,
"maxHeight": null,
"align": "center",
"verticalAlign": "bottom",
"layout": "horizontal",
"width": null,
"margin": 12,
"reversed": false
},
"series": [
{
"name": "m5zn.xlarge by Amazon Web Services",
"color": "#f7981d",
"data": [
{
"x": 1188.3837240015446,
"y": 2758.4787503811945
},
{
"x": 1185.1153581067135,
"y": 2754.9096680273333
},
{
"x": 1193.2790153182107,
"y": 2762.7829448237226
},
{
"x": 1192.0164112227053,
"y": 2759.6347222323334
},
{
"x": 1204.9514465682582,
"y": 2789.721936533564
},
{
"x": 1193.495023904809,
"y": 2774.920286050175
},
{
"x": 1195.5104564097624,
"y": 2789.780379422392
},
{
"x": 1195.9195306969575,
"y": 2777.894680688211
},
{
"x": 1197.6607041737986,
"y": 2789.350763591553
},
{
"x": 1205.00126686857,
"y": 2782.7335725306657
},
{
"x": 1227.2323972888175,
"y": 2844.2245041104206
},
{
"x": 1216.3197071709174,
"y": 2850.036877000114
},
{
"x": 1231.4253946489844,
"y": 2840.7132622040745
},
{
"x": 1229.815014850671,
"y": 2859.8242283850936
},
{
"x": 1213.6514481139309,
"y": 2834.289149497963
},
{
"x": 1219.6564121499368,
"y": 2819.284082392689
},
{
"x": 1226.7445740402675,
"y": 2843.808396726696
},
{
"x": 1212.440479814096,
"y": 2831.472689842324
},
{
"x": 1219.3766273576728,
"y": 2832.0159903783933
},
{
"x": 1225.83175643589,
"y": 2847.744652574986
},
{
"x": 1230.392222583935,
"y": 2842.584371364731
},
{
"x": 1218.6619925124623,
"y": 2841.0725524600803
},
{
"x": 1228.1973446407983,
"y": 2840.713787120654
},
{
"x": 1234.405990678428,
"y": 2841.512429239356
},
{
"x": 1219.2215965305063,
"y": 2843.6352000918587
},
{
"x": 1209.5754314407095,
"y": 2823.651142192241
},
{
"x": 1220.2248311556784,
"y": 2841.8277058888534
},
{
"x": 1209.6092107452967,
"y": 2839.5951965754534
},
{
"x": 1221.2185574811592,
"y": 2831.0324650456114
},
{
"x": 1231.6086936943507,
"y": 2851.484142147683
}
]
}
],
"drilldown": {},
"tooltip": {
"enabled": true,
"useHTML": false,
"format": null,
"headerFormat": "",
"pointFormat": "<span style=\"color:{series.color}\">Single</span>: <b>{point.x:.0f}</b><br><span style=\"color:{series.color}\">Multi</span>: <b>{point.y:.0f}</b>",
"footerFormat": "",
"shared": false,
"outside": false,
"valueDecimals": null,
"split": false
},
"annotations": null
},
"hc_type": "chart",
"id": "248831021046529526083883876749700436169"
}
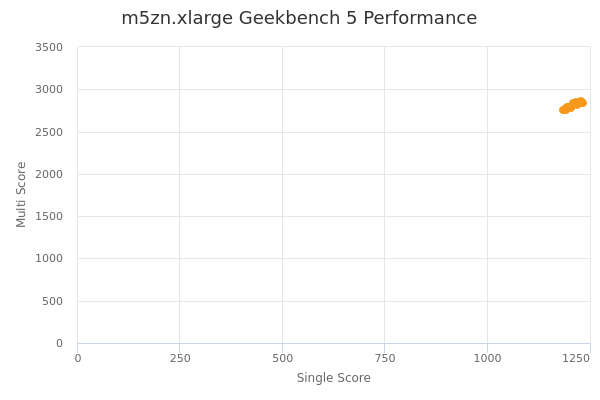
| Single | Multi | |
|---|---|---|
| Max | 1234 | 2860 |
| Average | 1213 | 2818 |
| Deviation | 14.58 | 32.91 |
| Min | 1185 | 2755 |
Sign up as Freemium to get more insight.
- In same series
- m5zn.large
- m5zn.xlarge
- m5zn.2xlarge
- m5zn.3xlarge
- m5zn.6xlarge
- m5zn.12xlarge
- m5zn.metal