m5zn.6xlarge by Amazon Web Services
Geekbench is a cross-platform processor benchmark with a scoring system that determines single-core and multi-core performance using loads simulating real-world scenarios. Geekbench 5 score is calculated with a reference score of 2500 representing the performance of the Intel Core i5-2520M @ 2.50 GHz. The software benchmark is available for Mac OS, Windows, Linux, Android and iOS platforms.
Specifications:
CPU
24
RAM
96.0 GB
Net
50000 Mbps
{
"configuration": {
"chart": {
"type": "scatter",
"polar": false,
"zoomType": "",
"options3d": {},
"height": null,
"width": null,
"margin": null,
"inverted": false,
"zooming": {}
},
"credits": {
"enabled": false
},
"title": {
"text": ""
},
"colorAxis": null,
"subtitle": {
"text": ""
},
"xAxis": {
"title": {
"text": [
"Single Score"
],
"useHTML": false,
"style": {
"color": "#666666"
}
},
"categories": null,
"lineWidth": 1,
"tickInterval": null,
"tickWidth": 1,
"tickLength": 10,
"tickPixelInterval": 100,
"plotLines": null,
"labels": {
"enabled": true,
"format": null,
"formatter": "",
"style": {
"color": "#666666",
"cursor": "default",
"fontSize": "11px"
},
"useHTML": false,
"step": 0
},
"plotBands": null,
"visible": true,
"floor": null,
"ceiling": null,
"type": "linear",
"min": 0,
"gridLineWidth": 1,
"gridLineColor": "#e6e6e6",
"minorTickInterval": null,
"minorTickWidth": 0,
"minTickInterval": null,
"startOnTick": true,
"endOnTick": true,
"tickmarkPlacement": 100,
"units": 100,
"minRange": 100
},
"yAxis": {
"title": {
"text": [
"Multi Score"
],
"useHTML": false,
"style": {
"color": "#666666"
}
},
"categories": null,
"plotLines": null,
"plotBands": null,
"lineWidth": null,
"tickInterval": null,
"tickLength": 10,
"floor": null,
"ceiling": null,
"gridLineInterpolation": null,
"gridLineWidth": 1,
"gridLineColor": "#e6e6e6",
"min": 0,
"max": null,
"minorTickInterval": null,
"minorTickWidth": 0,
"minTickInterval": null,
"startOnTick": true,
"endOnTick": true,
"minRange": null,
"type": "linear",
"tickmarkPlacement": null,
"labels": {
"enabled": true,
"formatter": null,
"style": {
"color": "#666666",
"cursor": "default",
"fontSize": "11px"
},
"useHTML": false
}
},
"zAxis": {
"title": {
"text": "Multi Score"
}
},
"plotOptions": {
"series": {
"dataLabels": {
"enabled": false,
"format": null,
"distance": 30,
"align": "center",
"inside": null,
"allowOverlap": false,
"style": {
"fontSize": "11px"
}
},
"showInLegend": null,
"turboThreshold": 0,
"stacking": "",
"groupPadding": 0.2,
"centerInCategory": false,
"findNearestPointBy": "x"
}
},
"navigator": {
"enabled": false
},
"scrollbar": {
"enabled": false
},
"rangeSelector": {
"enabled": false,
"inputEnabled": false
},
"legend": {
"enabled": null,
"maxHeight": null,
"align": "center",
"verticalAlign": "bottom",
"layout": "horizontal",
"width": null,
"margin": 12,
"reversed": false
},
"series": [
{
"name": "m5zn.6xlarge by Amazon Web Services",
"color": "#f7981d",
"data": [
{
"x": 1219.6545651147278,
"y": 14711.909332336578
},
{
"x": 1219.1890241507836,
"y": 14762.02384721922
},
{
"x": 1223.4518327968042,
"y": 14769.428127623676
},
{
"x": 1222.3082769057694,
"y": 14716.056884188563
},
{
"x": 1221.1967580207772,
"y": 14739.090923123304
},
{
"x": 1219.1552777824832,
"y": 14684.80545400724
},
{
"x": 1215.676471879129,
"y": 14765.64270982697
},
{
"x": 1223.3897458911101,
"y": 14732.566632585622
},
{
"x": 1223.0013292042704,
"y": 14761.022041709486
},
{
"x": 1222.9768424551366,
"y": 14724.085120514534
},
{
"x": 1223.2675435098959,
"y": 14756.900659381925
},
{
"x": 1222.4441624316378,
"y": 14719.818348229817
},
{
"x": 1224.5861699922189,
"y": 14735.665371541982
},
{
"x": 1216.1898340295584,
"y": 14708.37479279782
},
{
"x": 1220.1812323485533,
"y": 14764.027225616606
},
{
"x": 1228.9507219309887,
"y": 14721.406809436507
},
{
"x": 1222.1728220474258,
"y": 14721.68798389018
},
{
"x": 1222.3707155637999,
"y": 14769.555722263427
},
{
"x": 1218.774278893092,
"y": 14692.865156802418
},
{
"x": 1225.9275913378374,
"y": 14748.674609230093
}
]
}
],
"drilldown": {},
"tooltip": {
"enabled": true,
"useHTML": false,
"format": null,
"headerFormat": "",
"pointFormat": "<span style=\"color:{series.color}\">Single</span>: <b>{point.x:.0f}</b><br><span style=\"color:{series.color}\">Multi</span>: <b>{point.y:.0f}</b>",
"footerFormat": "",
"shared": false,
"outside": false,
"valueDecimals": null,
"split": false
},
"annotations": null
},
"hc_type": "chart",
"id": "139186554447196212688957290711287329759"
}
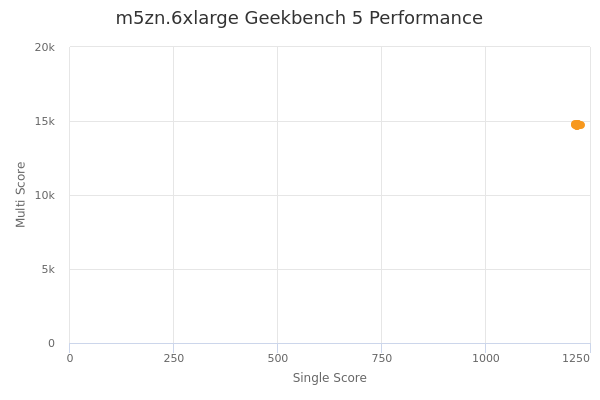
| Single | Multi | |
|---|---|---|
| Max | 1229 | 14770 |
| Average | 1222 | 14735 |
| Deviation | 3.06 | 25.36 |
| Min | 1216 | 14685 |
Sign up as Freemium to get more insight.
- In same series
- m5zn.large
- m5zn.xlarge
- m5zn.2xlarge
- m5zn.3xlarge
- m5zn.6xlarge
- m5zn.12xlarge
- m5zn.metal