m5zn.metal by Amazon Web Services
Geekbench is a cross-platform processor benchmark with a scoring system that determines single-core and multi-core performance using loads simulating real-world scenarios. Geekbench 5 score is calculated with a reference score of 2500 representing the performance of the Intel Core i5-2520M @ 2.50 GHz. The software benchmark is available for Mac OS, Windows, Linux, Android and iOS platforms.
Specifications:
CPU
48
RAM
192.0 GB
Net
100000 Mbps
{
"configuration": {
"chart": {
"type": "scatter",
"polar": false,
"zoomType": "",
"options3d": {},
"height": null,
"width": null,
"margin": null,
"inverted": false,
"zooming": {}
},
"credits": {
"enabled": false
},
"title": {
"text": ""
},
"colorAxis": null,
"subtitle": {
"text": ""
},
"xAxis": {
"title": {
"text": [
"Single Score"
],
"useHTML": false,
"style": {
"color": "#666666"
}
},
"categories": null,
"lineWidth": 1,
"tickInterval": null,
"tickWidth": 1,
"tickLength": 10,
"tickPixelInterval": 100,
"plotLines": null,
"labels": {
"enabled": true,
"format": null,
"formatter": "",
"style": {
"color": "#666666",
"cursor": "default",
"fontSize": "11px"
},
"useHTML": false,
"step": 0
},
"plotBands": null,
"visible": true,
"floor": null,
"ceiling": null,
"type": "linear",
"min": 0,
"gridLineWidth": 1,
"gridLineColor": "#e6e6e6",
"minorTickInterval": null,
"minorTickWidth": 0,
"minTickInterval": null,
"startOnTick": true,
"endOnTick": true,
"tickmarkPlacement": 100,
"units": 100,
"minRange": 100
},
"yAxis": {
"title": {
"text": [
"Multi Score"
],
"useHTML": false,
"style": {
"color": "#666666"
}
},
"categories": null,
"plotLines": null,
"plotBands": null,
"lineWidth": null,
"tickInterval": null,
"tickLength": 10,
"floor": null,
"ceiling": null,
"gridLineInterpolation": null,
"gridLineWidth": 1,
"gridLineColor": "#e6e6e6",
"min": 0,
"max": null,
"minorTickInterval": null,
"minorTickWidth": 0,
"minTickInterval": null,
"startOnTick": true,
"endOnTick": true,
"minRange": null,
"type": "linear",
"tickmarkPlacement": null,
"labels": {
"enabled": true,
"formatter": null,
"style": {
"color": "#666666",
"cursor": "default",
"fontSize": "11px"
},
"useHTML": false
}
},
"zAxis": {
"title": {
"text": "Multi Score"
}
},
"plotOptions": {
"series": {
"dataLabels": {
"enabled": false,
"format": null,
"distance": 30,
"align": "center",
"inside": null,
"allowOverlap": false,
"style": {
"fontSize": "11px"
}
},
"showInLegend": null,
"turboThreshold": 0,
"stacking": "",
"groupPadding": 0.2,
"centerInCategory": false,
"findNearestPointBy": "x"
}
},
"navigator": {
"enabled": false
},
"scrollbar": {
"enabled": false
},
"rangeSelector": {
"enabled": false,
"inputEnabled": false
},
"legend": {
"enabled": null,
"maxHeight": null,
"align": "center",
"verticalAlign": "bottom",
"layout": "horizontal",
"width": null,
"margin": 12,
"reversed": false
},
"series": [
{
"name": "m5zn.metal by Amazon Web Services",
"color": "#f7981d",
"data": [
{
"x": 1251.794404278221,
"y": 26153.35420255665
},
{
"x": 1250.5628250332143,
"y": 25993.35756370212
},
{
"x": 1250.9599018115805,
"y": 25987.60774834123
},
{
"x": 1241.6585032388125,
"y": 25998.19955867578
},
{
"x": 1244.9699826224205,
"y": 26029.966371045335
},
{
"x": 1245.7895211862956,
"y": 26091.282086880492
},
{
"x": 1239.111235257666,
"y": 25794.451482555436
},
{
"x": 1247.209390848643,
"y": 26079.685267734116
},
{
"x": 1245.4910851284108,
"y": 25992.020578669948
},
{
"x": 1244.0016795079175,
"y": 26550.605717012048
},
{
"x": 1245.0051999410007,
"y": 25913.331995919303
},
{
"x": 1246.2179816295163,
"y": 25856.01702148626
},
{
"x": 1242.5567011246203,
"y": 26011.82507414353
},
{
"x": 1252.796816787874,
"y": 25602.093523538835
},
{
"x": 1241.2066706479889,
"y": 25816.447630144317
},
{
"x": 1246.6523735278793,
"y": 26130.017755324578
},
{
"x": 1250.5643940381824,
"y": 25773.4949318129
},
{
"x": 1246.135082515279,
"y": 25955.050700318352
},
{
"x": 1249.0168295360145,
"y": 25800.449639918006
},
{
"x": 1252.0679369811546,
"y": 26152.95861766181
}
]
}
],
"drilldown": {},
"tooltip": {
"enabled": true,
"useHTML": false,
"format": null,
"headerFormat": "",
"pointFormat": "<span style=\"color:{series.color}\">Single</span>: <b>{point.x:.0f}</b><br><span style=\"color:{series.color}\">Multi</span>: <b>{point.y:.0f}</b>",
"footerFormat": "",
"shared": false,
"outside": false,
"valueDecimals": null,
"split": false
},
"annotations": null
},
"hc_type": "chart",
"id": "223330055403541148715773603388481203274"
}
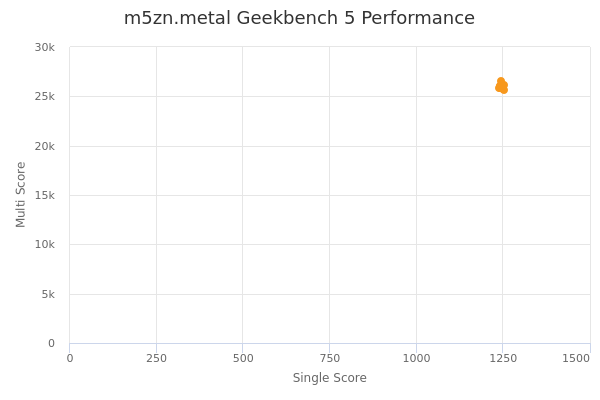
| Single | Multi | |
|---|---|---|
| Max | 1253 | 26551 |
| Average | 1247 | 25984 |
| Deviation | 3.82 | 191.52 |
| Min | 1239 | 25602 |
Sign up as Freemium to get more insight.
- In same series
- m5zn.large
- m5zn.xlarge
- m5zn.2xlarge
- m5zn.3xlarge
- m5zn.6xlarge
- m5zn.12xlarge
- m5zn.metal