m5zn.3xlarge by Amazon Web Services
Geekbench is a cross-platform processor benchmark with a scoring system that determines single-core and multi-core performance using loads simulating real-world scenarios. Geekbench 5 score is calculated with a reference score of 2500 representing the performance of the Intel Core i5-2520M @ 2.50 GHz. The software benchmark is available for Mac OS, Windows, Linux, Android and iOS platforms.
Specifications:
CPU
12
RAM
48.0 GB
Net
25000 Mbps
{
"configuration": {
"chart": {
"type": "scatter",
"polar": false,
"zoomType": "",
"options3d": {},
"height": null,
"width": null,
"margin": null,
"inverted": false,
"zooming": {}
},
"credits": {
"enabled": false
},
"title": {
"text": ""
},
"colorAxis": null,
"subtitle": {
"text": ""
},
"xAxis": {
"title": {
"text": [
"Single Score"
],
"useHTML": false,
"style": {
"color": "#666666"
}
},
"categories": null,
"lineWidth": 1,
"tickInterval": null,
"tickWidth": 1,
"tickLength": 10,
"tickPixelInterval": 100,
"plotLines": null,
"labels": {
"enabled": true,
"format": null,
"formatter": "",
"style": {
"color": "#666666",
"cursor": "default",
"fontSize": "11px"
},
"useHTML": false,
"step": 0
},
"plotBands": null,
"visible": true,
"floor": null,
"ceiling": null,
"type": "linear",
"min": 0,
"gridLineWidth": 1,
"gridLineColor": "#e6e6e6",
"minorTickInterval": null,
"minorTickWidth": 0,
"minTickInterval": null,
"startOnTick": true,
"endOnTick": true,
"tickmarkPlacement": 100,
"units": 100,
"minRange": 100
},
"yAxis": {
"title": {
"text": [
"Multi Score"
],
"useHTML": false,
"style": {
"color": "#666666"
}
},
"categories": null,
"plotLines": null,
"plotBands": null,
"lineWidth": null,
"tickInterval": null,
"tickLength": 10,
"floor": null,
"ceiling": null,
"gridLineInterpolation": null,
"gridLineWidth": 1,
"gridLineColor": "#e6e6e6",
"min": 0,
"max": null,
"minorTickInterval": null,
"minorTickWidth": 0,
"minTickInterval": null,
"startOnTick": true,
"endOnTick": true,
"minRange": null,
"type": "linear",
"tickmarkPlacement": null,
"labels": {
"enabled": true,
"formatter": null,
"style": {
"color": "#666666",
"cursor": "default",
"fontSize": "11px"
},
"useHTML": false
}
},
"zAxis": {
"title": {
"text": "Multi Score"
}
},
"plotOptions": {
"series": {
"dataLabels": {
"enabled": false,
"format": null,
"distance": 30,
"align": "center",
"inside": null,
"allowOverlap": false,
"style": {
"fontSize": "11px"
}
},
"showInLegend": null,
"turboThreshold": 0,
"stacking": "",
"groupPadding": 0.2,
"centerInCategory": false,
"findNearestPointBy": "x"
}
},
"navigator": {
"enabled": false
},
"scrollbar": {
"enabled": false
},
"rangeSelector": {
"enabled": false,
"inputEnabled": false
},
"legend": {
"enabled": null,
"maxHeight": null,
"align": "center",
"verticalAlign": "bottom",
"layout": "horizontal",
"width": null,
"margin": 12,
"reversed": false
},
"series": [
{
"name": "m5zn.3xlarge by Amazon Web Services",
"color": "#f7981d",
"data": [
{
"x": 1250.8800322719217,
"y": 8125.094076332385
},
{
"x": 1236.6928991397126,
"y": 8112.0579090078945
},
{
"x": 1251.6839320877568,
"y": 8116.639433804665
},
{
"x": 1240.5743532609242,
"y": 8090.91184887407
},
{
"x": 1248.6161074083013,
"y": 8131.418247647303
},
{
"x": 1240.2277713988676,
"y": 8107.568362061877
},
{
"x": 1246.9428928310135,
"y": 8139.095801557054
},
{
"x": 1239.1548826860999,
"y": 8098.66721883585
},
{
"x": 1247.4050959550489,
"y": 8127.711396405601
},
{
"x": 1239.2270338933697,
"y": 8087.333492260274
},
{
"x": 1241.954006005508,
"y": 8120.04048938427
},
{
"x": 1235.799075059565,
"y": 8113.332777406185
},
{
"x": 1247.2584129411484,
"y": 8132.367389509223
},
{
"x": 1234.5129446657108,
"y": 8102.437774428394
},
{
"x": 1247.0453292690977,
"y": 8116.960554966126
},
{
"x": 1241.623263346235,
"y": 8108.524882897906
},
{
"x": 1243.7124665438737,
"y": 8118.425138732913
},
{
"x": 1236.0373126844693,
"y": 8113.32084830882
},
{
"x": 1248.4687291812531,
"y": 8126.198177122831
},
{
"x": 1239.0929407948213,
"y": 8100.470930365132
},
{
"x": 1236.5794898684371,
"y": 8133.5536985542385
},
{
"x": 1208.7266811176107,
"y": 8013.241759937422
},
{
"x": 1234.2615995772503,
"y": 8138.649007211283
},
{
"x": 1213.3955275364176,
"y": 8019.373036655146
},
{
"x": 1236.6973478198443,
"y": 8132.350770505094
},
{
"x": 1215.9748226965082,
"y": 7998.711984800671
},
{
"x": 1237.7418985944958,
"y": 8135.149754364349
},
{
"x": 1220.2249143838014,
"y": 8002.508694821949
},
{
"x": 1236.926019930868,
"y": 8146.46882900101
},
{
"x": 1217.7861320159022,
"y": 8007.67240889278
},
{
"x": 1237.0676980848784,
"y": 8138.681027000692
},
{
"x": 1211.6297946879672,
"y": 8000.024608340074
},
{
"x": 1244.9426526249117,
"y": 8137.521580732222
},
{
"x": 1218.0123445485615,
"y": 7996.815318295543
},
{
"x": 1243.926528054298,
"y": 8138.382679632823
},
{
"x": 1218.9606440787331,
"y": 8000.542759970789
},
{
"x": 1242.6386400579313,
"y": 8127.7979448279275
},
{
"x": 1216.4132695116032,
"y": 8000.922101893457
},
{
"x": 1236.6021980572475,
"y": 8128.3051796036725
},
{
"x": 1211.3705816943043,
"y": 7983.55557228312
}
]
}
],
"drilldown": {},
"tooltip": {
"enabled": true,
"useHTML": false,
"format": null,
"headerFormat": "",
"pointFormat": "<span style=\"color:{series.color}\">Single</span>: <b>{point.x:.0f}</b><br><span style=\"color:{series.color}\">Multi</span>: <b>{point.y:.0f}</b>",
"footerFormat": "",
"shared": false,
"outside": false,
"valueDecimals": null,
"split": false
},
"annotations": null
},
"hc_type": "chart",
"id": "45239873067834008120082958802661988398"
}
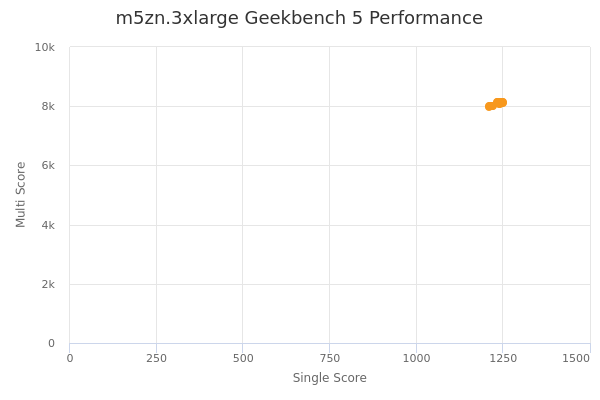
| Single | Multi | |
|---|---|---|
| Max | 1252 | 8146 |
| Average | 1235 | 8092 |
| Deviation | 12.31 | 53.46 |
| Min | 1209 | 7984 |
Sign up as Freemium to get more insight.
- In same series
- m5zn.large
- m5zn.xlarge
- m5zn.2xlarge
- m5zn.3xlarge
- m5zn.6xlarge
- m5zn.12xlarge
- m5zn.metal