m5zn.2xlarge by Amazon Web Services
Geekbench is a cross-platform processor benchmark with a scoring system that determines single-core and multi-core performance using loads simulating real-world scenarios. Geekbench 5 score is calculated with a reference score of 2500 representing the performance of the Intel Core i5-2520M @ 2.50 GHz. The software benchmark is available for Mac OS, Windows, Linux, Android and iOS platforms.
Specifications:
CPU
8
RAM
32.0 GB
Net
25000 Mbps
{
"configuration": {
"chart": {
"type": "scatter",
"polar": false,
"zoomType": "",
"options3d": {},
"height": null,
"width": null,
"margin": null,
"inverted": false,
"zooming": {}
},
"credits": {
"enabled": false
},
"title": {
"text": ""
},
"colorAxis": null,
"subtitle": {
"text": ""
},
"xAxis": {
"title": {
"text": [
"Single Score"
],
"useHTML": false,
"style": {
"color": "#666666"
}
},
"categories": null,
"lineWidth": 1,
"tickInterval": null,
"tickWidth": 1,
"tickLength": 10,
"tickPixelInterval": 100,
"plotLines": null,
"labels": {
"enabled": true,
"format": null,
"formatter": "",
"style": {
"color": "#666666",
"cursor": "default",
"fontSize": "11px"
},
"useHTML": false,
"step": 0
},
"plotBands": null,
"visible": true,
"floor": null,
"ceiling": null,
"type": "linear",
"min": 0,
"gridLineWidth": 1,
"gridLineColor": "#e6e6e6",
"minorTickInterval": null,
"minorTickWidth": 0,
"minTickInterval": null,
"startOnTick": true,
"endOnTick": true,
"tickmarkPlacement": 100,
"units": 100,
"minRange": 100
},
"yAxis": {
"title": {
"text": [
"Multi Score"
],
"useHTML": false,
"style": {
"color": "#666666"
}
},
"categories": null,
"plotLines": null,
"plotBands": null,
"lineWidth": null,
"tickInterval": null,
"tickLength": 10,
"floor": null,
"ceiling": null,
"gridLineInterpolation": null,
"gridLineWidth": 1,
"gridLineColor": "#e6e6e6",
"min": 0,
"max": null,
"minorTickInterval": null,
"minorTickWidth": 0,
"minTickInterval": null,
"startOnTick": true,
"endOnTick": true,
"minRange": null,
"type": "linear",
"tickmarkPlacement": null,
"labels": {
"enabled": true,
"formatter": null,
"style": {
"color": "#666666",
"cursor": "default",
"fontSize": "11px"
},
"useHTML": false
}
},
"zAxis": {
"title": {
"text": "Multi Score"
}
},
"plotOptions": {
"series": {
"dataLabels": {
"enabled": false,
"format": null,
"distance": 30,
"align": "center",
"inside": null,
"allowOverlap": false,
"style": {
"fontSize": "11px"
}
},
"showInLegend": null,
"turboThreshold": 0,
"stacking": "",
"groupPadding": 0.2,
"centerInCategory": false,
"findNearestPointBy": "x"
}
},
"navigator": {
"enabled": false
},
"scrollbar": {
"enabled": false
},
"rangeSelector": {
"enabled": false,
"inputEnabled": false
},
"legend": {
"enabled": null,
"maxHeight": null,
"align": "center",
"verticalAlign": "bottom",
"layout": "horizontal",
"width": null,
"margin": 12,
"reversed": false
},
"series": [
{
"name": "m5zn.2xlarge by Amazon Web Services",
"color": "#f7981d",
"data": [
{
"x": 1227.9038967406645,
"y": 5555.130803667232
},
{
"x": 1232.0716362882051,
"y": 5555.37991848899
},
{
"x": 1234.4045100876426,
"y": 5549.537659599357
},
{
"x": 1226.4457336885919,
"y": 5549.327667324213
},
{
"x": 1231.2874898776747,
"y": 5564.122168260143
},
{
"x": 1205.1679174798508,
"y": 5508.978172770204
},
{
"x": 1230.764506103845,
"y": 5552.781560563833
},
{
"x": 1218.1119205120997,
"y": 5538.433446712309
},
{
"x": 1229.1380041577497,
"y": 5555.666582809979
},
{
"x": 1228.7988993910794,
"y": 5528.497684479012
},
{
"x": 1230.49071506464,
"y": 5558.161979280081
},
{
"x": 1223.3008577335097,
"y": 5538.105919741714
},
{
"x": 1227.8826276395575,
"y": 5545.494324850948
},
{
"x": 1223.5865130278544,
"y": 5552.830774891297
},
{
"x": 1233.5232802876878,
"y": 5548.320716933574
},
{
"x": 1220.4761209375538,
"y": 5558.027765096038
},
{
"x": 1229.5885383180375,
"y": 5558.098510748081
},
{
"x": 1220.5269327742428,
"y": 5532.5979398774525
},
{
"x": 1226.627542139076,
"y": 5553.9344160851515
},
{
"x": 1225.0810398246858,
"y": 5535.082724376082
},
{
"x": 1212.7002556409977,
"y": 5412.26796708135
},
{
"x": 1211.7665046607942,
"y": 5421.143984126765
},
{
"x": 1213.0841360861286,
"y": 5378.107375543441
},
{
"x": 1212.383624864504,
"y": 5370.364020573111
},
{
"x": 1211.1067911069956,
"y": 5414.370616722354
},
{
"x": 1206.9214648774769,
"y": 5425.903977170579
},
{
"x": 1214.1496793455735,
"y": 5401.742283382768
},
{
"x": 1209.6249863253051,
"y": 5387.450700615879
},
{
"x": 1208.2369878270947,
"y": 5413.941265236471
},
{
"x": 1215.4269710570302,
"y": 5407.916270159171
},
{
"x": 1206.1870427704137,
"y": 5387.771146648893
},
{
"x": 1206.7778583796917,
"y": 5388.967790793977
}
]
}
],
"drilldown": {},
"tooltip": {
"enabled": true,
"useHTML": false,
"format": null,
"headerFormat": "",
"pointFormat": "<span style=\"color:{series.color}\">Single</span>: <b>{point.x:.0f}</b><br><span style=\"color:{series.color}\">Multi</span>: <b>{point.y:.0f}</b>",
"footerFormat": "",
"shared": false,
"outside": false,
"valueDecimals": null,
"split": false
},
"annotations": null
},
"hc_type": "chart",
"id": "206093339595924883004334567642510629308"
}
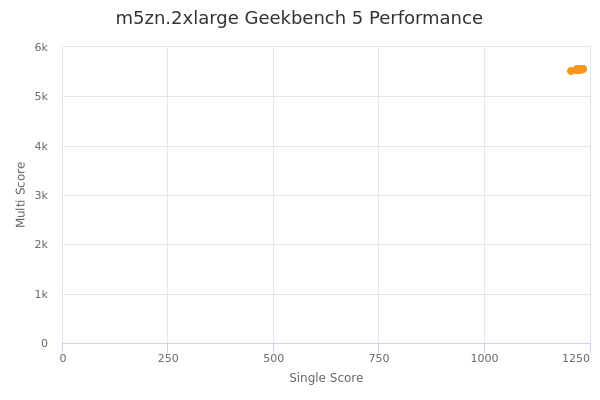
| Single | Multi | |
|---|---|---|
| Max | 1234 | 5564 |
| Average | 1220 | 5492 |
| Deviation | 9.29 | 72.22 |
| Min | 1205 | 5370 |
Sign up as Freemium to get more insight.
- In same series
- m5zn.large
- m5zn.xlarge
- m5zn.2xlarge
- m5zn.3xlarge
- m5zn.6xlarge
- m5zn.12xlarge
- m5zn.metal