c6id.4xlarge by Amazon Web Services
Geekbench is a cross-platform processor benchmark with a scoring system that determines single-core and multi-core performance using loads simulating real-world scenarios. Geekbench 5 score is calculated with a reference score of 2500 representing the performance of the Intel Core i5-2520M @ 2.50 GHz. The software benchmark is available for Mac OS, Windows, Linux, Android and iOS platforms.
Specifications:
CPU
16
RAM
32.0 GB
Extra
1x
950 GB
SSD
Net
12000 Mbps
{
"configuration": {
"chart": {
"type": "scatter",
"polar": false,
"zoomType": "",
"options3d": {},
"height": null,
"width": null,
"margin": null,
"inverted": false,
"zooming": {}
},
"credits": {
"enabled": false
},
"title": {
"text": ""
},
"colorAxis": null,
"subtitle": {
"text": ""
},
"xAxis": {
"title": {
"text": [
"Single Score"
],
"useHTML": false,
"style": {
"color": "#666666"
}
},
"categories": null,
"lineWidth": 1,
"tickInterval": null,
"tickWidth": 1,
"tickLength": 10,
"tickPixelInterval": 100,
"plotLines": null,
"labels": {
"enabled": true,
"format": null,
"formatter": "",
"style": {
"color": "#666666",
"cursor": "default",
"fontSize": "11px"
},
"useHTML": false,
"step": 0
},
"plotBands": null,
"visible": true,
"floor": null,
"ceiling": null,
"type": "linear",
"min": 0,
"gridLineWidth": 1,
"gridLineColor": "#e6e6e6",
"minorTickInterval": null,
"minorTickWidth": 0,
"minTickInterval": null,
"startOnTick": true,
"endOnTick": true,
"tickmarkPlacement": 100,
"units": 100,
"minRange": 100
},
"yAxis": {
"title": {
"text": [
"Multi Score"
],
"useHTML": false,
"style": {
"color": "#666666"
}
},
"categories": null,
"plotLines": null,
"plotBands": null,
"lineWidth": null,
"tickInterval": null,
"tickLength": 10,
"floor": null,
"ceiling": null,
"gridLineInterpolation": null,
"gridLineWidth": 1,
"gridLineColor": "#e6e6e6",
"min": 0,
"max": null,
"minorTickInterval": null,
"minorTickWidth": 0,
"minTickInterval": null,
"startOnTick": true,
"endOnTick": true,
"minRange": null,
"type": "linear",
"tickmarkPlacement": null,
"labels": {
"enabled": true,
"formatter": null,
"style": {
"color": "#666666",
"cursor": "default",
"fontSize": "11px"
},
"useHTML": false
}
},
"zAxis": {
"title": {
"text": "Multi Score"
}
},
"plotOptions": {
"series": {
"dataLabels": {
"enabled": false,
"format": null,
"distance": 30,
"align": "center",
"inside": null,
"allowOverlap": false,
"style": {
"fontSize": "11px"
}
},
"showInLegend": null,
"turboThreshold": 0,
"stacking": "",
"groupPadding": 0.2,
"centerInCategory": false,
"findNearestPointBy": "x"
}
},
"navigator": {
"enabled": false
},
"scrollbar": {
"enabled": false
},
"rangeSelector": {
"enabled": false,
"inputEnabled": false
},
"legend": {
"enabled": null,
"maxHeight": null,
"align": "center",
"verticalAlign": "bottom",
"layout": "horizontal",
"width": null,
"margin": 12,
"reversed": false
},
"series": [
{
"name": "c6id.4xlarge by Amazon Web Services",
"color": "#f7981d",
"data": [
{
"x": 1235.8384844477337,
"y": 10113.433627894778
},
{
"x": 1225.6358302735719,
"y": 10122.626572111894
},
{
"x": 1247.7417968161178,
"y": 10085.453371085741
},
{
"x": 1234.1862679495273,
"y": 10071.037245694542
},
{
"x": 1250.535472052402,
"y": 10069.593715341207
},
{
"x": 1242.5859252522962,
"y": 10094.717573124179
},
{
"x": 1244.9587882148207,
"y": 10087.2778184462
},
{
"x": 1239.8322222130955,
"y": 10075.639204354258
},
{
"x": 1235.557886139999,
"y": 10077.309824564327
},
{
"x": 1239.9572191166903,
"y": 10093.207870815831
},
{
"x": 1248.779826043005,
"y": 10142.651651811037
},
{
"x": 1236.050157477233,
"y": 10081.866677275086
},
{
"x": 1247.600711008454,
"y": 10094.78964091864
},
{
"x": 1228.9088034342963,
"y": 10051.941558656063
},
{
"x": 1249.2166486516428,
"y": 10051.891581385411
},
{
"x": 1233.472947961517,
"y": 10075.477338691404
},
{
"x": 1244.8702821456916,
"y": 10084.828310268373
},
{
"x": 1240.4306474889484,
"y": 10090.449231801635
},
{
"x": 1246.282766821952,
"y": 10063.453846884151
},
{
"x": 1221.6065344849633,
"y": 10099.539637244721
}
]
}
],
"drilldown": {},
"tooltip": {
"enabled": true,
"useHTML": false,
"format": null,
"headerFormat": "",
"pointFormat": "<span style=\"color:{series.color}\">Single</span>: <b>{point.x:.0f}</b><br><span style=\"color:{series.color}\">Multi</span>: <b>{point.y:.0f}</b>",
"footerFormat": "",
"shared": false,
"outside": false,
"valueDecimals": null,
"split": false
},
"annotations": null
},
"hc_type": "chart",
"id": "51324403347147177892858144450007839177"
}
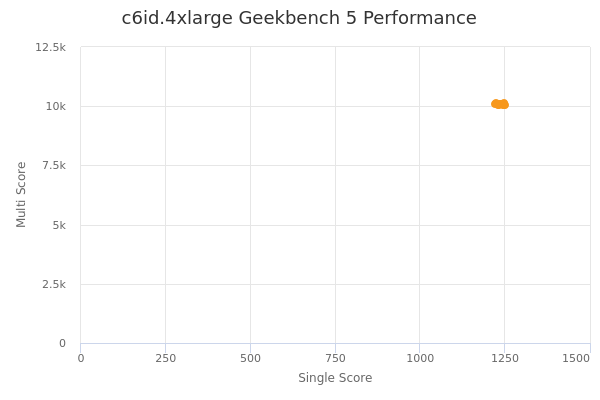
| Single | Multi | |
|---|---|---|
| Max | 1251 | 10143 |
| Average | 1240 | 10086 |
| Deviation | 8.00 | 21.62 |
| Min | 1222 | 10052 |
Sign up as Freemium to get more insight.