c6id.large by Amazon Web Services
Geekbench is a cross-platform processor benchmark with a scoring system that determines single-core and multi-core performance using loads simulating real-world scenarios. Geekbench 5 score is calculated with a reference score of 2500 representing the performance of the Intel Core i5-2520M @ 2.50 GHz. The software benchmark is available for Mac OS, Windows, Linux, Android and iOS platforms.
Specifications:
CPU
2
RAM
4.0 GB
Extra
1x
118 GB
SSD
Net
12000 Mbps
{
"configuration": {
"chart": {
"type": "scatter",
"polar": false,
"zoomType": "",
"options3d": {},
"height": null,
"width": null,
"margin": null,
"inverted": false,
"zooming": {}
},
"credits": {
"enabled": false
},
"title": {
"text": ""
},
"colorAxis": null,
"subtitle": {
"text": ""
},
"xAxis": {
"title": {
"text": [
"Single Score"
],
"useHTML": false,
"style": {
"color": "#666666"
}
},
"categories": null,
"lineWidth": 1,
"tickInterval": null,
"tickWidth": 1,
"tickLength": 10,
"tickPixelInterval": 100,
"plotLines": null,
"labels": {
"enabled": true,
"format": null,
"formatter": "",
"style": {
"color": "#666666",
"cursor": "default",
"fontSize": "11px"
},
"useHTML": false,
"step": 0
},
"plotBands": null,
"visible": true,
"floor": null,
"ceiling": null,
"type": "linear",
"min": 0,
"gridLineWidth": 1,
"gridLineColor": "#e6e6e6",
"minorTickInterval": null,
"minorTickWidth": 0,
"minTickInterval": null,
"startOnTick": true,
"endOnTick": true,
"tickmarkPlacement": 100,
"units": 100,
"minRange": 100
},
"yAxis": {
"title": {
"text": [
"Multi Score"
],
"useHTML": false,
"style": {
"color": "#666666"
}
},
"categories": null,
"plotLines": null,
"plotBands": null,
"lineWidth": null,
"tickInterval": null,
"tickLength": 10,
"floor": null,
"ceiling": null,
"gridLineInterpolation": null,
"gridLineWidth": 1,
"gridLineColor": "#e6e6e6",
"min": 0,
"max": null,
"minorTickInterval": null,
"minorTickWidth": 0,
"minTickInterval": null,
"startOnTick": true,
"endOnTick": true,
"minRange": null,
"type": "linear",
"tickmarkPlacement": null,
"labels": {
"enabled": true,
"formatter": null,
"style": {
"color": "#666666",
"cursor": "default",
"fontSize": "11px"
},
"useHTML": false
}
},
"zAxis": {
"title": {
"text": "Multi Score"
}
},
"plotOptions": {
"series": {
"dataLabels": {
"enabled": false,
"format": null,
"distance": 30,
"align": "center",
"inside": null,
"allowOverlap": false,
"style": {
"fontSize": "11px"
}
},
"showInLegend": null,
"turboThreshold": 0,
"stacking": "",
"groupPadding": 0.2,
"centerInCategory": false,
"findNearestPointBy": "x"
}
},
"navigator": {
"enabled": false
},
"scrollbar": {
"enabled": false
},
"rangeSelector": {
"enabled": false,
"inputEnabled": false
},
"legend": {
"enabled": null,
"maxHeight": null,
"align": "center",
"verticalAlign": "bottom",
"layout": "horizontal",
"width": null,
"margin": 12,
"reversed": false
},
"series": [
{
"name": "c6id.large by Amazon Web Services",
"color": "#f7981d",
"data": [
{
"x": 1198.0778146584248,
"y": 1422.1483728611597
},
{
"x": 1123.4187541619526,
"y": 1347.986574136683
},
{
"x": 1212.2274936198496,
"y": 1425.3375815629167
},
{
"x": 1126.4998005857942,
"y": 1339.477355996872
},
{
"x": 1217.9442996137072,
"y": 1421.2432122304117
},
{
"x": 1118.834633235825,
"y": 1358.0867163275057
},
{
"x": 1202.3669976539095,
"y": 1425.8578846682967
},
{
"x": 1139.2119117128873,
"y": 1353.080382966226
},
{
"x": 1212.2978929813187,
"y": 1420.0570755058989
},
{
"x": 1129.6884204160795,
"y": 1354.6134049284897
},
{
"x": 1211.0244854277562,
"y": 1414.4703609828002
},
{
"x": 1136.6383474574684,
"y": 1340.657035464086
},
{
"x": 1218.0256266266458,
"y": 1426.166810382971
},
{
"x": 1123.5030367701386,
"y": 1346.091513941583
},
{
"x": 1226.3557975310289,
"y": 1425.6357023799446
},
{
"x": 1126.6910256276487,
"y": 1350.7583398668378
},
{
"x": 1221.2172228618174,
"y": 1429.7752904329839
},
{
"x": 1125.1863701319464,
"y": 1333.7869473901171
},
{
"x": 1218.4725217399298,
"y": 1427.0148162527219
},
{
"x": 1130.6322280328586,
"y": 1359.7159280105775
}
]
}
],
"drilldown": {},
"tooltip": {
"enabled": true,
"useHTML": false,
"format": null,
"headerFormat": "",
"pointFormat": "<span style=\"color:{series.color}\">Single</span>: <b>{point.x:.0f}</b><br><span style=\"color:{series.color}\">Multi</span>: <b>{point.y:.0f}</b>",
"footerFormat": "",
"shared": false,
"outside": false,
"valueDecimals": null,
"split": false
},
"annotations": null
},
"hc_type": "chart",
"id": "204348115204905220328288283954187911676"
}
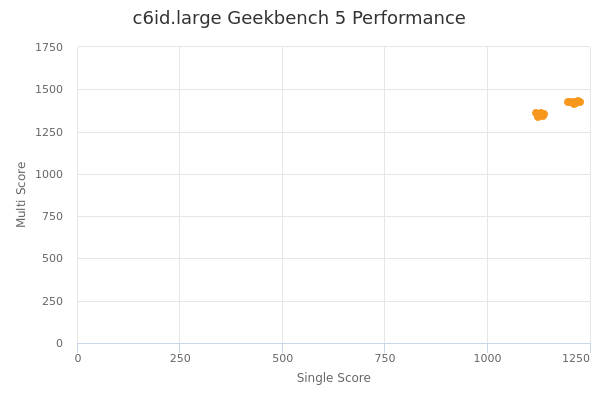
| Single | Multi | |
|---|---|---|
| Max | 1226 | 1430 |
| Average | 1171 | 1386 |
| Deviation | 43.47 | 38.21 |
| Min | 1119 | 1334 |
Sign up as Freemium to get more insight.