c6id.12xlarge by Amazon Web Services
Geekbench is a cross-platform processor benchmark with a scoring system that determines single-core and multi-core performance using loads simulating real-world scenarios. Geekbench 5 score is calculated with a reference score of 2500 representing the performance of the Intel Core i5-2520M @ 2.50 GHz. The software benchmark is available for Mac OS, Windows, Linux, Android and iOS platforms.
Specifications:
CPU
48
RAM
96.0 GB
Extra
2x
1425 GB
SSD
Net
18000 Mbps
{
"configuration": {
"chart": {
"type": "scatter",
"polar": false,
"zoomType": "",
"options3d": {},
"height": null,
"width": null,
"margin": null,
"inverted": false,
"zooming": {}
},
"credits": {
"enabled": false
},
"title": {
"text": ""
},
"colorAxis": null,
"subtitle": {
"text": ""
},
"xAxis": {
"title": {
"text": [
"Single Score"
],
"useHTML": false,
"style": {
"color": "#666666"
}
},
"categories": null,
"lineWidth": 1,
"tickInterval": null,
"tickWidth": 1,
"tickLength": 10,
"tickPixelInterval": 100,
"plotLines": null,
"labels": {
"enabled": true,
"format": null,
"formatter": "",
"style": {
"color": "#666666",
"cursor": "default",
"fontSize": "11px"
},
"useHTML": false,
"step": 0
},
"plotBands": null,
"visible": true,
"floor": null,
"ceiling": null,
"type": "linear",
"min": 0,
"gridLineWidth": 1,
"gridLineColor": "#e6e6e6",
"minorTickInterval": null,
"minorTickWidth": 0,
"minTickInterval": null,
"startOnTick": true,
"endOnTick": true,
"tickmarkPlacement": 100,
"units": 100,
"minRange": 100
},
"yAxis": {
"title": {
"text": [
"Multi Score"
],
"useHTML": false,
"style": {
"color": "#666666"
}
},
"categories": null,
"plotLines": null,
"plotBands": null,
"lineWidth": null,
"tickInterval": null,
"tickLength": 10,
"floor": null,
"ceiling": null,
"gridLineInterpolation": null,
"gridLineWidth": 1,
"gridLineColor": "#e6e6e6",
"min": 0,
"max": null,
"minorTickInterval": null,
"minorTickWidth": 0,
"minTickInterval": null,
"startOnTick": true,
"endOnTick": true,
"minRange": null,
"type": "linear",
"tickmarkPlacement": null,
"labels": {
"enabled": true,
"formatter": null,
"style": {
"color": "#666666",
"cursor": "default",
"fontSize": "11px"
},
"useHTML": false
}
},
"zAxis": {
"title": {
"text": "Multi Score"
}
},
"plotOptions": {
"series": {
"dataLabels": {
"enabled": false,
"format": null,
"distance": 30,
"align": "center",
"inside": null,
"allowOverlap": false,
"style": {
"fontSize": "11px"
}
},
"showInLegend": null,
"turboThreshold": 0,
"stacking": "",
"groupPadding": 0.2,
"centerInCategory": false,
"findNearestPointBy": "x"
}
},
"navigator": {
"enabled": false
},
"scrollbar": {
"enabled": false
},
"rangeSelector": {
"enabled": false,
"inputEnabled": false
},
"legend": {
"enabled": null,
"maxHeight": null,
"align": "center",
"verticalAlign": "bottom",
"layout": "horizontal",
"width": null,
"margin": 12,
"reversed": false
},
"series": [
{
"name": "c6id.12xlarge by Amazon Web Services",
"color": "#f7981d",
"data": [
{
"x": 1263.0922912927872,
"y": 25851.28377405131
},
{
"x": 1264.108379190333,
"y": 25600.72115589727
},
{
"x": 1271.5870473939929,
"y": 25773.20996534743
},
{
"x": 1266.104912624388,
"y": 25888.171451912003
},
{
"x": 1256.1451920225768,
"y": 25784.1007349723
},
{
"x": 1258.104688912087,
"y": 25768.866603930474
},
{
"x": 1268.3441228874894,
"y": 25733.875051301977
},
{
"x": 1268.5563019938472,
"y": 25777.87997585218
},
{
"x": 1269.531210924118,
"y": 25671.208986096863
},
{
"x": 1258.407643871392,
"y": 25671.76311884385
},
{
"x": 1257.9372731547815,
"y": 25701.836087560274
},
{
"x": 1257.0940601119337,
"y": 25750.511599161007
},
{
"x": 1264.6926724053237,
"y": 25756.13601103011
},
{
"x": 1269.0634190342985,
"y": 25758.554922693613
},
{
"x": 1268.012810669536,
"y": 25826.75135661146
},
{
"x": 1263.2502421559711,
"y": 25687.262410036106
},
{
"x": 1269.7733195325832,
"y": 25714.83860640486
},
{
"x": 1262.0087405054874,
"y": 25729.802283063167
},
{
"x": 1270.6930314525948,
"y": 25714.273169765336
},
{
"x": 1262.5077319126153,
"y": 25705.24644103503
}
]
}
],
"drilldown": {},
"tooltip": {
"enabled": true,
"useHTML": false,
"format": null,
"headerFormat": "",
"pointFormat": "<span style=\"color:{series.color}\">Single</span>: <b>{point.x:.0f}</b><br><span style=\"color:{series.color}\">Multi</span>: <b>{point.y:.0f}</b>",
"footerFormat": "",
"shared": false,
"outside": false,
"valueDecimals": null,
"split": false
},
"annotations": null
},
"hc_type": "chart",
"id": "82153234679085021509559591269638219042"
}
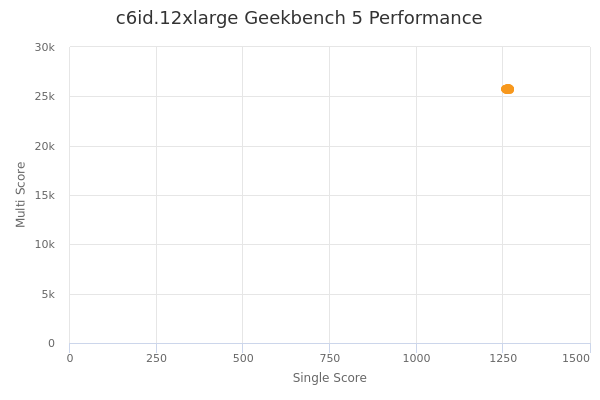
| Single | Multi | |
|---|---|---|
| Max | 1272 | 25888 |
| Average | 1264 | 25743 |
| Deviation | 4.84 | 64.55 |
| Min | 1256 | 25601 |
Sign up as Freemium to get more insight.