c6id.16xlarge by Amazon Web Services
Geekbench is a cross-platform processor benchmark with a scoring system that determines single-core and multi-core performance using loads simulating real-world scenarios. Geekbench 5 score is calculated with a reference score of 2500 representing the performance of the Intel Core i5-2520M @ 2.50 GHz. The software benchmark is available for Mac OS, Windows, Linux, Android and iOS platforms.
Specifications:
CPU
64
RAM
128.0 GB
Extra
2x
1900 GB
SSD
Net
25000 Mbps
{
"configuration": {
"chart": {
"type": "scatter",
"polar": false,
"zoomType": "",
"options3d": {},
"height": null,
"width": null,
"margin": null,
"inverted": false,
"zooming": {}
},
"credits": {
"enabled": false
},
"title": {
"text": ""
},
"colorAxis": null,
"subtitle": {
"text": ""
},
"xAxis": {
"title": {
"text": [
"Single Score"
],
"useHTML": false,
"style": {
"color": "#666666"
}
},
"categories": null,
"lineWidth": 1,
"tickInterval": null,
"tickWidth": 1,
"tickLength": 10,
"tickPixelInterval": 100,
"plotLines": null,
"labels": {
"enabled": true,
"format": null,
"formatter": "",
"style": {
"color": "#666666",
"cursor": "default",
"fontSize": "11px"
},
"useHTML": false,
"step": 0
},
"plotBands": null,
"visible": true,
"floor": null,
"ceiling": null,
"type": "linear",
"min": 0,
"gridLineWidth": 1,
"gridLineColor": "#e6e6e6",
"minorTickInterval": null,
"minorTickWidth": 0,
"minTickInterval": null,
"startOnTick": true,
"endOnTick": true,
"tickmarkPlacement": 100,
"units": 100,
"minRange": 100
},
"yAxis": {
"title": {
"text": [
"Multi Score"
],
"useHTML": false,
"style": {
"color": "#666666"
}
},
"categories": null,
"plotLines": null,
"plotBands": null,
"lineWidth": null,
"tickInterval": null,
"tickLength": 10,
"floor": null,
"ceiling": null,
"gridLineInterpolation": null,
"gridLineWidth": 1,
"gridLineColor": "#e6e6e6",
"min": 0,
"max": null,
"minorTickInterval": null,
"minorTickWidth": 0,
"minTickInterval": null,
"startOnTick": true,
"endOnTick": true,
"minRange": null,
"type": "linear",
"tickmarkPlacement": null,
"labels": {
"enabled": true,
"formatter": null,
"style": {
"color": "#666666",
"cursor": "default",
"fontSize": "11px"
},
"useHTML": false
}
},
"zAxis": {
"title": {
"text": "Multi Score"
}
},
"plotOptions": {
"series": {
"dataLabels": {
"enabled": false,
"format": null,
"distance": 30,
"align": "center",
"inside": null,
"allowOverlap": false,
"style": {
"fontSize": "11px"
}
},
"showInLegend": null,
"turboThreshold": 0,
"stacking": "",
"groupPadding": 0.2,
"centerInCategory": false,
"findNearestPointBy": "x"
}
},
"navigator": {
"enabled": false
},
"scrollbar": {
"enabled": false
},
"rangeSelector": {
"enabled": false,
"inputEnabled": false
},
"legend": {
"enabled": null,
"maxHeight": null,
"align": "center",
"verticalAlign": "bottom",
"layout": "horizontal",
"width": null,
"margin": 12,
"reversed": false
},
"series": [
{
"name": "c6id.16xlarge by Amazon Web Services",
"color": "#f7981d",
"data": [
{
"x": 1269.6785454725475,
"y": 31582.236888930354
},
{
"x": 1253.0597058735243,
"y": 31421.77493038098
},
{
"x": 1252.180230194093,
"y": 30561.439637753763
},
{
"x": 1252.265994241773,
"y": 30628.434069429284
},
{
"x": 1266.1763632207476,
"y": 30855.955004404605
},
{
"x": 1253.6867717138982,
"y": 31730.54651204039
},
{
"x": 1264.3839203292496,
"y": 30268.958340560406
},
{
"x": 1250.8072604507151,
"y": 31648.048879362053
},
{
"x": 1264.024842285877,
"y": 30214.059456712137
},
{
"x": 1251.9808187505594,
"y": 30134.333103152807
},
{
"x": 1261.5893442417591,
"y": 30552.769832130733
},
{
"x": 1251.5323758983302,
"y": 30655.63507721429
},
{
"x": 1264.4681378950675,
"y": 30262.18174217809
},
{
"x": 1253.1543541904327,
"y": 30632.60561228799
},
{
"x": 1264.0259805096562,
"y": 31842.543154133455
},
{
"x": 1251.7235602553865,
"y": 30307.334597993067
},
{
"x": 1251.8964850465395,
"y": 30786.974934763493
},
{
"x": 1249.860174600894,
"y": 30194.058209159768
},
{
"x": 1264.861233270298,
"y": 30314.805446799743
},
{
"x": 1252.0975406717387,
"y": 30225.12887161153
}
]
}
],
"drilldown": {},
"tooltip": {
"enabled": true,
"useHTML": false,
"format": null,
"headerFormat": "",
"pointFormat": "<span style=\"color:{series.color}\">Single</span>: <b>{point.x:.0f}</b><br><span style=\"color:{series.color}\">Multi</span>: <b>{point.y:.0f}</b>",
"footerFormat": "",
"shared": false,
"outside": false,
"valueDecimals": null,
"split": false
},
"annotations": null
},
"hc_type": "chart",
"id": "131316685671851555380632795003803661040"
}
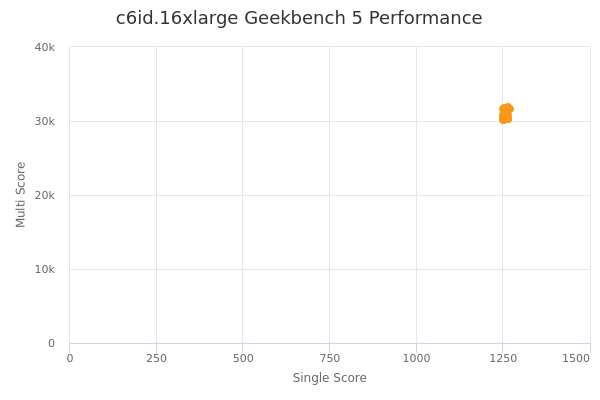
| Single | Multi | |
|---|---|---|
| Max | 1270 | 31843 |
| Average | 1257 | 30741 |
| Deviation | 6.50 | 562.76 |
| Min | 1250 | 30134 |
Sign up as Freemium to get more insight.