c5ad.large by Amazon Web Services
Geekbench is a cross-platform processor benchmark with a scoring system that determines single-core and multi-core performance using loads simulating real-world scenarios. Geekbench 5 score is calculated with a reference score of 2500 representing the performance of the Intel Core i5-2520M @ 2.50 GHz. The software benchmark is available for Mac OS, Windows, Linux, Android and iOS platforms.
Specifications:
CPU
2
RAM
4.0 GB
Extra
1x
75 GB
NVMe SSD
Net
10000 Mbps
{
"configuration": {
"chart": {
"type": "scatter",
"polar": false,
"zoomType": "",
"options3d": {},
"height": null,
"width": null,
"margin": null,
"inverted": false,
"zooming": {}
},
"credits": {
"enabled": false
},
"title": {
"text": ""
},
"colorAxis": null,
"subtitle": {
"text": ""
},
"xAxis": {
"title": {
"text": [
"Single Score"
],
"useHTML": false,
"style": {
"color": "#666666"
}
},
"categories": null,
"lineWidth": 1,
"tickInterval": null,
"tickWidth": 1,
"tickLength": 10,
"tickPixelInterval": 100,
"plotLines": null,
"labels": {
"enabled": true,
"format": null,
"formatter": "",
"style": {
"color": "#666666",
"cursor": "default",
"fontSize": "11px"
},
"useHTML": false,
"step": 0
},
"plotBands": null,
"visible": true,
"floor": null,
"ceiling": null,
"type": "linear",
"min": 0,
"gridLineWidth": 1,
"gridLineColor": "#e6e6e6",
"minorTickInterval": null,
"minorTickWidth": 0,
"minTickInterval": null,
"startOnTick": true,
"endOnTick": true,
"tickmarkPlacement": 100,
"units": 100,
"minRange": 100
},
"yAxis": {
"title": {
"text": [
"Multi Score"
],
"useHTML": false,
"style": {
"color": "#666666"
}
},
"categories": null,
"plotLines": null,
"plotBands": null,
"lineWidth": null,
"tickInterval": null,
"tickLength": 10,
"floor": null,
"ceiling": null,
"gridLineInterpolation": null,
"gridLineWidth": 1,
"gridLineColor": "#e6e6e6",
"min": 0,
"max": null,
"minorTickInterval": null,
"minorTickWidth": 0,
"minTickInterval": null,
"startOnTick": true,
"endOnTick": true,
"minRange": null,
"type": "linear",
"tickmarkPlacement": null,
"labels": {
"enabled": true,
"formatter": null,
"style": {
"color": "#666666",
"cursor": "default",
"fontSize": "11px"
},
"useHTML": false
}
},
"zAxis": {
"title": {
"text": "Multi Score"
}
},
"plotOptions": {
"series": {
"dataLabels": {
"enabled": false,
"format": null,
"distance": 30,
"align": "center",
"inside": null,
"allowOverlap": false,
"style": {
"fontSize": "11px"
}
},
"showInLegend": null,
"turboThreshold": 0,
"stacking": "",
"groupPadding": 0.2,
"centerInCategory": false,
"findNearestPointBy": "x"
}
},
"navigator": {
"enabled": false
},
"scrollbar": {
"enabled": false
},
"rangeSelector": {
"enabled": false,
"inputEnabled": false
},
"legend": {
"enabled": null,
"maxHeight": null,
"align": "center",
"verticalAlign": "bottom",
"layout": "horizontal",
"width": null,
"margin": 12,
"reversed": false
},
"series": [
{
"name": "c5ad.large by Amazon Web Services",
"color": "#f7981d",
"data": [
{
"x": 964.1339746113051,
"y": 1235.3805338607679
},
{
"x": 960.0114332453572,
"y": 1231.6281913974458
},
{
"x": 964.7231314569425,
"y": 1240.2868736346852
},
{
"x": 967.6299344795959,
"y": 1235.1891540167221
},
{
"x": 963.8122623970557,
"y": 1223.5530469282962
},
{
"x": 966.4367208048757,
"y": 1231.391299931322
},
{
"x": 969.2785245031423,
"y": 1232.71413544254
},
{
"x": 953.8976910288336,
"y": 1224.4221933617525
},
{
"x": 964.5493529739491,
"y": 1228.3242324019664
},
{
"x": 959.9317427166789,
"y": 1222.669105113663
},
{
"x": 963.5896345419023,
"y": 1231.3666517159547
},
{
"x": 958.1981881607164,
"y": 1216.1419289118096
},
{
"x": 964.3051315278124,
"y": 1238.7513204963443
},
{
"x": 958.780017102262,
"y": 1228.0916222945848
},
{
"x": 968.3467246239647,
"y": 1238.5052665639291
},
{
"x": 960.290696349685,
"y": 1220.5711197375858
},
{
"x": 960.2434123314945,
"y": 1232.4863681740762
},
{
"x": 955.6100111075714,
"y": 1217.9336434253032
},
{
"x": 970.2728193382693,
"y": 1229.4915352196235
},
{
"x": 956.1141725402078,
"y": 1223.4337533362122
}
]
}
],
"drilldown": {},
"tooltip": {
"enabled": true,
"useHTML": false,
"format": null,
"headerFormat": "",
"pointFormat": "<span style=\"color:{series.color}\">Single</span>: <b>{point.x:.0f}</b><br><span style=\"color:{series.color}\">Multi</span>: <b>{point.y:.0f}</b>",
"footerFormat": "",
"shared": false,
"outside": false,
"valueDecimals": null,
"split": false
},
"annotations": null
},
"hc_type": "chart",
"id": "41706037901964318758133431607568273102"
}
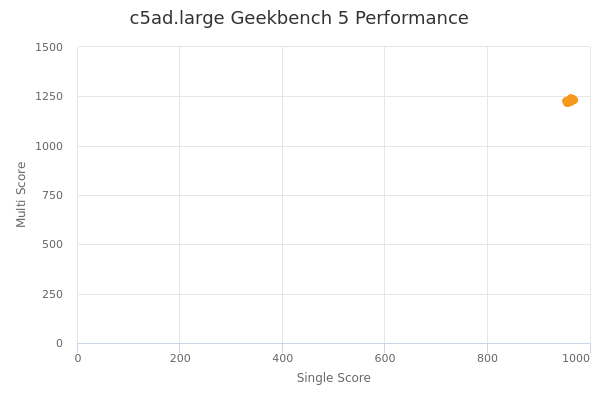
| Single | Multi | |
|---|---|---|
| Max | 970 | 1240 |
| Average | 963 | 1229 |
| Deviation | 4.57 | 6.77 |
| Min | 954 | 1216 |
Sign up as Freemium to get more insight.