c5ad.8xlarge by Amazon Web Services
Geekbench is a cross-platform processor benchmark with a scoring system that determines single-core and multi-core performance using loads simulating real-world scenarios. Geekbench 5 score is calculated with a reference score of 2500 representing the performance of the Intel Core i5-2520M @ 2.50 GHz. The software benchmark is available for Mac OS, Windows, Linux, Android and iOS platforms.
Specifications:
CPU
32
RAM
64.0 GB
Extra
2x
600 GB
NVMe SSD
Net
10000 Mbps
{
"configuration": {
"chart": {
"type": "scatter",
"polar": false,
"zoomType": "",
"options3d": {},
"height": null,
"width": null,
"margin": null,
"inverted": false,
"zooming": {}
},
"credits": {
"enabled": false
},
"title": {
"text": ""
},
"colorAxis": null,
"subtitle": {
"text": ""
},
"xAxis": {
"title": {
"text": [
"Single Score"
],
"useHTML": false,
"style": {
"color": "#666666"
}
},
"categories": null,
"lineWidth": 1,
"tickInterval": null,
"tickWidth": 1,
"tickLength": 10,
"tickPixelInterval": 100,
"plotLines": null,
"labels": {
"enabled": true,
"format": null,
"formatter": "",
"style": {
"color": "#666666",
"cursor": "default",
"fontSize": "11px"
},
"useHTML": false,
"step": 0
},
"plotBands": null,
"visible": true,
"floor": null,
"ceiling": null,
"type": "linear",
"min": 0,
"gridLineWidth": 1,
"gridLineColor": "#e6e6e6",
"minorTickInterval": null,
"minorTickWidth": 0,
"minTickInterval": null,
"startOnTick": true,
"endOnTick": true,
"tickmarkPlacement": 100,
"units": 100,
"minRange": 100
},
"yAxis": {
"title": {
"text": [
"Multi Score"
],
"useHTML": false,
"style": {
"color": "#666666"
}
},
"categories": null,
"plotLines": null,
"plotBands": null,
"lineWidth": null,
"tickInterval": null,
"tickLength": 10,
"floor": null,
"ceiling": null,
"gridLineInterpolation": null,
"gridLineWidth": 1,
"gridLineColor": "#e6e6e6",
"min": 0,
"max": null,
"minorTickInterval": null,
"minorTickWidth": 0,
"minTickInterval": null,
"startOnTick": true,
"endOnTick": true,
"minRange": null,
"type": "linear",
"tickmarkPlacement": null,
"labels": {
"enabled": true,
"formatter": null,
"style": {
"color": "#666666",
"cursor": "default",
"fontSize": "11px"
},
"useHTML": false
}
},
"zAxis": {
"title": {
"text": "Multi Score"
}
},
"plotOptions": {
"series": {
"dataLabels": {
"enabled": false,
"format": null,
"distance": 30,
"align": "center",
"inside": null,
"allowOverlap": false,
"style": {
"fontSize": "11px"
}
},
"showInLegend": null,
"turboThreshold": 0,
"stacking": "",
"groupPadding": 0.2,
"centerInCategory": false,
"findNearestPointBy": "x"
}
},
"navigator": {
"enabled": false
},
"scrollbar": {
"enabled": false
},
"rangeSelector": {
"enabled": false,
"inputEnabled": false
},
"legend": {
"enabled": null,
"maxHeight": null,
"align": "center",
"verticalAlign": "bottom",
"layout": "horizontal",
"width": null,
"margin": 12,
"reversed": false
},
"series": [
{
"name": "c5ad.8xlarge by Amazon Web Services",
"color": "#f7981d",
"data": [
{
"x": 1044.2239235120996,
"y": 15847.109498332044
},
{
"x": 1042.5159768231586,
"y": 16106.108433881003
},
{
"x": 1042.9292695404374,
"y": 16262.722242877982
},
{
"x": 1043.6362815443822,
"y": 16172.930961290156
},
{
"x": 1043.1836494836102,
"y": 16212.997446477522
},
{
"x": 1039.0606698984082,
"y": 16233.203749691529
},
{
"x": 1045.2359930483942,
"y": 16099.015728932529
},
{
"x": 1040.2149854537504,
"y": 16206.065016777731
},
{
"x": 1033.0579475752825,
"y": 16269.706386605149
},
{
"x": 1031.3282366242217,
"y": 16211.380946345887
},
{
"x": 1035.4072534742043,
"y": 16153.18621306631
},
{
"x": 1022.5647942842435,
"y": 16161.345337885548
},
{
"x": 1034.7458139750836,
"y": 16109.451032608347
},
{
"x": 1014.9584713763422,
"y": 16202.337545962582
},
{
"x": 1037.0741161885321,
"y": 16205.352089341875
},
{
"x": 1011.2022007725068,
"y": 16293.873529627552
},
{
"x": 1035.8445212013985,
"y": 16114.86409958798
},
{
"x": 1014.7990876322131,
"y": 16271.113512284437
},
{
"x": 1042.5820114593905,
"y": 16032.021114171526
},
{
"x": 1014.985897817583,
"y": 16277.54730254643
}
]
}
],
"drilldown": {},
"tooltip": {
"enabled": true,
"useHTML": false,
"format": null,
"headerFormat": "",
"pointFormat": "<span style=\"color:{series.color}\">Single</span>: <b>{point.x:.0f}</b><br><span style=\"color:{series.color}\">Multi</span>: <b>{point.y:.0f}</b>",
"footerFormat": "",
"shared": false,
"outside": false,
"valueDecimals": null,
"split": false
},
"annotations": null
},
"hc_type": "chart",
"id": "331399314661833886879750590185222152691"
}
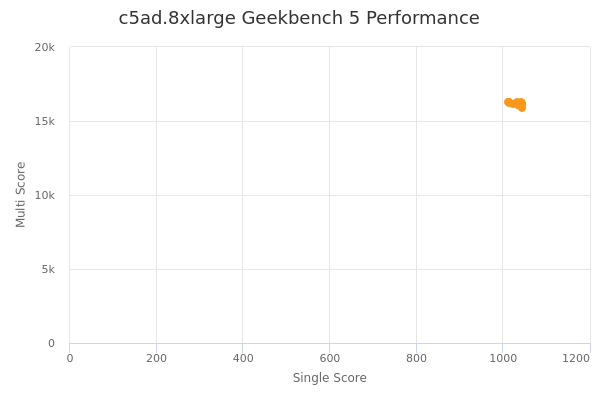
| Single | Multi | |
|---|---|---|
| Max | 1045 | 16294 |
| Average | 1033 | 16172 |
| Deviation | 11.09 | 101.54 |
| Min | 1011 | 15847 |
Sign up as Freemium to get more insight.