c5ad.4xlarge by Amazon Web Services
Geekbench is a cross-platform processor benchmark with a scoring system that determines single-core and multi-core performance using loads simulating real-world scenarios. Geekbench 5 score is calculated with a reference score of 2500 representing the performance of the Intel Core i5-2520M @ 2.50 GHz. The software benchmark is available for Mac OS, Windows, Linux, Android and iOS platforms.
Specifications:
CPU
16
RAM
32.0 GB
Extra
2x
300 GB
NVMe SSD
Net
10000 Mbps
{
"configuration": {
"chart": {
"type": "scatter",
"polar": false,
"zoomType": "",
"options3d": {},
"height": null,
"width": null,
"margin": null,
"inverted": false,
"zooming": {}
},
"credits": {
"enabled": false
},
"title": {
"text": ""
},
"colorAxis": null,
"subtitle": {
"text": ""
},
"xAxis": {
"title": {
"text": [
"Single Score"
],
"useHTML": false,
"style": {
"color": "#666666"
}
},
"categories": null,
"lineWidth": 1,
"tickInterval": null,
"tickWidth": 1,
"tickLength": 10,
"tickPixelInterval": 100,
"plotLines": null,
"labels": {
"enabled": true,
"format": null,
"formatter": "",
"style": {
"color": "#666666",
"cursor": "default",
"fontSize": "11px"
},
"useHTML": false,
"step": 0
},
"plotBands": null,
"visible": true,
"floor": null,
"ceiling": null,
"type": "linear",
"min": 0,
"gridLineWidth": 1,
"gridLineColor": "#e6e6e6",
"minorTickInterval": null,
"minorTickWidth": 0,
"minTickInterval": null,
"startOnTick": true,
"endOnTick": true,
"tickmarkPlacement": 100,
"units": 100,
"minRange": 100
},
"yAxis": {
"title": {
"text": [
"Multi Score"
],
"useHTML": false,
"style": {
"color": "#666666"
}
},
"categories": null,
"plotLines": null,
"plotBands": null,
"lineWidth": null,
"tickInterval": null,
"tickLength": 10,
"floor": null,
"ceiling": null,
"gridLineInterpolation": null,
"gridLineWidth": 1,
"gridLineColor": "#e6e6e6",
"min": 0,
"max": null,
"minorTickInterval": null,
"minorTickWidth": 0,
"minTickInterval": null,
"startOnTick": true,
"endOnTick": true,
"minRange": null,
"type": "linear",
"tickmarkPlacement": null,
"labels": {
"enabled": true,
"formatter": null,
"style": {
"color": "#666666",
"cursor": "default",
"fontSize": "11px"
},
"useHTML": false
}
},
"zAxis": {
"title": {
"text": "Multi Score"
}
},
"plotOptions": {
"series": {
"dataLabels": {
"enabled": false,
"format": null,
"distance": 30,
"align": "center",
"inside": null,
"allowOverlap": false,
"style": {
"fontSize": "11px"
}
},
"showInLegend": null,
"turboThreshold": 0,
"stacking": "",
"groupPadding": 0.2,
"centerInCategory": false,
"findNearestPointBy": "x"
}
},
"navigator": {
"enabled": false
},
"scrollbar": {
"enabled": false
},
"rangeSelector": {
"enabled": false,
"inputEnabled": false
},
"legend": {
"enabled": null,
"maxHeight": null,
"align": "center",
"verticalAlign": "bottom",
"layout": "horizontal",
"width": null,
"margin": 12,
"reversed": false
},
"series": [
{
"name": "c5ad.4xlarge by Amazon Web Services",
"color": "#f7981d",
"data": [
{
"x": 1041.2861375088894,
"y": 8374.001334783552
},
{
"x": 1034.0662151978643,
"y": 8471.854528030792
},
{
"x": 1039.3889926910763,
"y": 8398.458365548846
},
{
"x": 1033.7760989573467,
"y": 8450.804151045768
},
{
"x": 1041.0129166066927,
"y": 8397.985999506318
},
{
"x": 1036.2209016654178,
"y": 8482.580844144697
},
{
"x": 1040.6959974753734,
"y": 8318.37638950302
},
{
"x": 1034.1042632581223,
"y": 8455.04035256898
},
{
"x": 1040.358829970807,
"y": 8298.433288933877
},
{
"x": 1034.7566901139958,
"y": 8462.462022571524
},
{
"x": 1042.2971095816613,
"y": 8305.91375719443
},
{
"x": 1031.828215526265,
"y": 8450.865662763694
},
{
"x": 1042.6139099048112,
"y": 8324.892464506553
},
{
"x": 1030.2039887524647,
"y": 8460.383688959972
},
{
"x": 1045.049796543107,
"y": 8325.83984153021
},
{
"x": 1035.583150486028,
"y": 8477.345086986577
},
{
"x": 1041.159620737784,
"y": 8299.32532755225
},
{
"x": 1029.8550849784372,
"y": 8477.77008181307
},
{
"x": 1040.0863109616487,
"y": 8283.12481192575
},
{
"x": 1035.427530849105,
"y": 8451.877941256404
},
{
"x": 1053.8242650511168,
"y": 8469.193286025526
},
{
"x": 1039.7624497930017,
"y": 8416.204759465421
},
{
"x": 1057.8212479453384,
"y": 8470.056578737498
},
{
"x": 1042.0615245449214,
"y": 8415.886182895098
},
{
"x": 1058.0459294205377,
"y": 8474.403052580208
},
{
"x": 1041.301494377613,
"y": 8434.81014673921
},
{
"x": 1056.9598054765142,
"y": 8480.408410531973
},
{
"x": 1046.0992279179482,
"y": 8419.729043144544
},
{
"x": 1052.6871282665238,
"y": 8448.586719686511
},
{
"x": 1041.7069707953979,
"y": 8426.408940570447
},
{
"x": 1053.5283490519246,
"y": 8452.044526801492
},
{
"x": 1041.1840765860125,
"y": 8396.884730950771
},
{
"x": 1054.993352700813,
"y": 8469.590964387367
},
{
"x": 1038.684920496775,
"y": 8380.996244385538
},
{
"x": 1053.5900841631894,
"y": 8460.899082919826
},
{
"x": 1047.8576160962082,
"y": 8418.691346850366
},
{
"x": 1052.7101874808168,
"y": 8498.5267578827
},
{
"x": 1052.8901201771457,
"y": 8419.071062793444
},
{
"x": 1045.370278524106,
"y": 8475.496227646465
},
{
"x": 1048.9947153134956,
"y": 8433.354073544946
}
]
}
],
"drilldown": {},
"tooltip": {
"enabled": true,
"useHTML": false,
"format": null,
"headerFormat": "",
"pointFormat": "<span style=\"color:{series.color}\">Single</span>: <b>{point.x:.0f}</b><br><span style=\"color:{series.color}\">Multi</span>: <b>{point.y:.0f}</b>",
"footerFormat": "",
"shared": false,
"outside": false,
"valueDecimals": null,
"split": false
},
"annotations": null
},
"hc_type": "chart",
"id": "243752799432410061247928805748527551204"
}
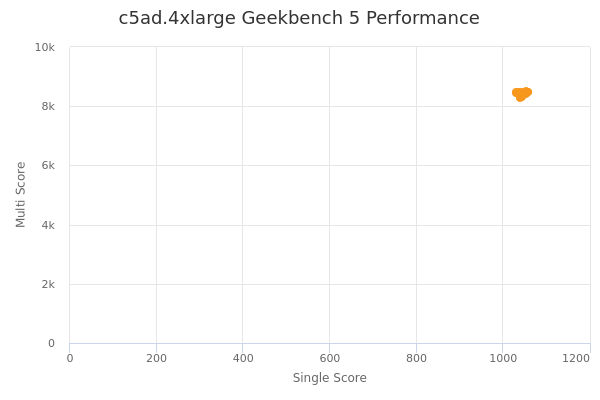
| Single | Multi | |
|---|---|---|
| Max | 1058 | 8499 |
| Average | 1043 | 8421 |
| Deviation | 7.91 | 59.68 |
| Min | 1030 | 8283 |
Sign up as Freemium to get more insight.