c5ad.16xlarge by Amazon Web Services
Geekbench is a cross-platform processor benchmark with a scoring system that determines single-core and multi-core performance using loads simulating real-world scenarios. Geekbench 5 score is calculated with a reference score of 2500 representing the performance of the Intel Core i5-2520M @ 2.50 GHz. The software benchmark is available for Mac OS, Windows, Linux, Android and iOS platforms.
Specifications:
CPU
64
RAM
128.0 GB
Extra
2x
1200 GB
NVMe SSD
Net
20000 Mbps
{
"configuration": {
"chart": {
"type": "scatter",
"polar": false,
"zoomType": "",
"options3d": {},
"height": null,
"width": null,
"margin": null,
"inverted": false,
"zooming": {}
},
"credits": {
"enabled": false
},
"title": {
"text": ""
},
"colorAxis": null,
"subtitle": {
"text": ""
},
"xAxis": {
"title": {
"text": [
"Single Score"
],
"useHTML": false,
"style": {
"color": "#666666"
}
},
"categories": null,
"lineWidth": 1,
"tickInterval": null,
"tickWidth": 1,
"tickLength": 10,
"tickPixelInterval": 100,
"plotLines": null,
"labels": {
"enabled": true,
"format": null,
"formatter": "",
"style": {
"color": "#666666",
"cursor": "default",
"fontSize": "11px"
},
"useHTML": false,
"step": 0
},
"plotBands": null,
"visible": true,
"floor": null,
"ceiling": null,
"type": "linear",
"min": 0,
"gridLineWidth": 1,
"gridLineColor": "#e6e6e6",
"minorTickInterval": null,
"minorTickWidth": 0,
"minTickInterval": null,
"startOnTick": true,
"endOnTick": true,
"tickmarkPlacement": 100,
"units": 100,
"minRange": 100
},
"yAxis": {
"title": {
"text": [
"Multi Score"
],
"useHTML": false,
"style": {
"color": "#666666"
}
},
"categories": null,
"plotLines": null,
"plotBands": null,
"lineWidth": null,
"tickInterval": null,
"tickLength": 10,
"floor": null,
"ceiling": null,
"gridLineInterpolation": null,
"gridLineWidth": 1,
"gridLineColor": "#e6e6e6",
"min": 0,
"max": null,
"minorTickInterval": null,
"minorTickWidth": 0,
"minTickInterval": null,
"startOnTick": true,
"endOnTick": true,
"minRange": null,
"type": "linear",
"tickmarkPlacement": null,
"labels": {
"enabled": true,
"formatter": null,
"style": {
"color": "#666666",
"cursor": "default",
"fontSize": "11px"
},
"useHTML": false
}
},
"zAxis": {
"title": {
"text": "Multi Score"
}
},
"plotOptions": {
"series": {
"dataLabels": {
"enabled": false,
"format": null,
"distance": 30,
"align": "center",
"inside": null,
"allowOverlap": false,
"style": {
"fontSize": "11px"
}
},
"showInLegend": null,
"turboThreshold": 0,
"stacking": "",
"groupPadding": 0.2,
"centerInCategory": false,
"findNearestPointBy": "x"
}
},
"navigator": {
"enabled": false
},
"scrollbar": {
"enabled": false
},
"rangeSelector": {
"enabled": false,
"inputEnabled": false
},
"legend": {
"enabled": null,
"maxHeight": null,
"align": "center",
"verticalAlign": "bottom",
"layout": "horizontal",
"width": null,
"margin": 12,
"reversed": false
},
"series": [
{
"name": "c5ad.16xlarge by Amazon Web Services",
"color": "#f7981d",
"data": [
{
"x": 1022.1704328283258,
"y": 29225.830432797753
},
{
"x": 1012.9530586680102,
"y": 28826.215342052783
},
{
"x": 1017.8951508557216,
"y": 28797.48547875136
},
{
"x": 1014.961770257627,
"y": 28825.312536778365
},
{
"x": 1021.4633118875033,
"y": 28647.449499197915
},
{
"x": 1017.0103675217294,
"y": 28555.36671201128
},
{
"x": 1016.5085781139794,
"y": 28106.93040573384
},
{
"x": 1013.7420437704932,
"y": 28387.002346255176
},
{
"x": 1015.2687973309573,
"y": 28695.388742349518
},
{
"x": 1014.8031781404127,
"y": 28768.552855530426
},
{
"x": 1013.1701286821476,
"y": 28470.274925788013
},
{
"x": 1015.9510840827916,
"y": 28829.410564881917
},
{
"x": 1019.3572116440955,
"y": 28717.393910490893
},
{
"x": 1014.5228212862658,
"y": 28502.16920222509
},
{
"x": 1024.9589828492128,
"y": 28692.17859462304
},
{
"x": 1013.8034391294653,
"y": 27851.822874455305
},
{
"x": 1023.488724365141,
"y": 28454.973106919395
},
{
"x": 1012.7381061332981,
"y": 28282.629986505388
},
{
"x": 1021.2895183266712,
"y": 28966.565400052827
},
{
"x": 1015.68262637728,
"y": 28406.9221979865
}
]
}
],
"drilldown": {},
"tooltip": {
"enabled": true,
"useHTML": false,
"format": null,
"headerFormat": "",
"pointFormat": "<span style=\"color:{series.color}\">Single</span>: <b>{point.x:.0f}</b><br><span style=\"color:{series.color}\">Multi</span>: <b>{point.y:.0f}</b>",
"footerFormat": "",
"shared": false,
"outside": false,
"valueDecimals": null,
"split": false
},
"annotations": null
},
"hc_type": "chart",
"id": "268889393606687598442633765035007209131"
}
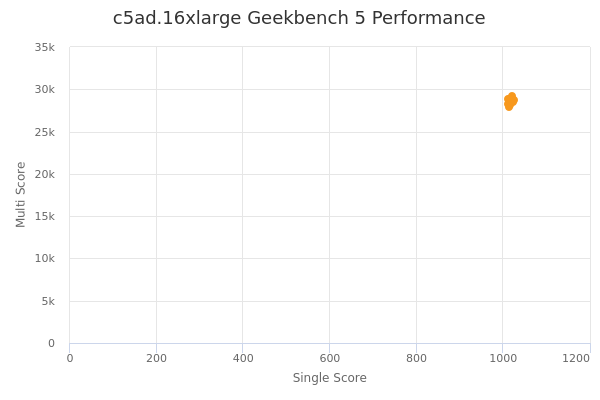
| Single | Multi | |
|---|---|---|
| Max | 1025 | 29226 |
| Average | 1017 | 28600 |
| Deviation | 3.66 | 301.44 |
| Min | 1013 | 27852 |
Sign up as Freemium to get more insight.