c5ad.24xlarge by Amazon Web Services
Geekbench is a cross-platform processor benchmark with a scoring system that determines single-core and multi-core performance using loads simulating real-world scenarios. Geekbench 5 score is calculated with a reference score of 2500 representing the performance of the Intel Core i5-2520M @ 2.50 GHz. The software benchmark is available for Mac OS, Windows, Linux, Android and iOS platforms.
Specifications:
CPU
96
RAM
192.0 GB
Extra
2x
1900 GB
NVMe SSD
Net
20000 Mbps
{
"configuration": {
"chart": {
"type": "scatter",
"polar": false,
"zoomType": "",
"options3d": {},
"height": null,
"width": null,
"margin": null,
"inverted": false,
"zooming": {}
},
"credits": {
"enabled": false
},
"title": {
"text": ""
},
"colorAxis": null,
"subtitle": {
"text": ""
},
"xAxis": {
"title": {
"text": [
"Single Score"
],
"useHTML": false,
"style": {
"color": "#666666"
}
},
"categories": null,
"lineWidth": 1,
"tickInterval": null,
"tickWidth": 1,
"tickLength": 10,
"tickPixelInterval": 100,
"plotLines": null,
"labels": {
"enabled": true,
"format": null,
"formatter": "",
"style": {
"color": "#666666",
"cursor": "default",
"fontSize": "11px"
},
"useHTML": false,
"step": 0
},
"plotBands": null,
"visible": true,
"floor": null,
"ceiling": null,
"type": "linear",
"min": 0,
"gridLineWidth": 1,
"gridLineColor": "#e6e6e6",
"minorTickInterval": null,
"minorTickWidth": 0,
"minTickInterval": null,
"startOnTick": true,
"endOnTick": true,
"tickmarkPlacement": 100,
"units": 100,
"minRange": 100
},
"yAxis": {
"title": {
"text": [
"Multi Score"
],
"useHTML": false,
"style": {
"color": "#666666"
}
},
"categories": null,
"plotLines": null,
"plotBands": null,
"lineWidth": null,
"tickInterval": null,
"tickLength": 10,
"floor": null,
"ceiling": null,
"gridLineInterpolation": null,
"gridLineWidth": 1,
"gridLineColor": "#e6e6e6",
"min": 0,
"max": null,
"minorTickInterval": null,
"minorTickWidth": 0,
"minTickInterval": null,
"startOnTick": true,
"endOnTick": true,
"minRange": null,
"type": "linear",
"tickmarkPlacement": null,
"labels": {
"enabled": true,
"formatter": null,
"style": {
"color": "#666666",
"cursor": "default",
"fontSize": "11px"
},
"useHTML": false
}
},
"zAxis": {
"title": {
"text": "Multi Score"
}
},
"plotOptions": {
"series": {
"dataLabels": {
"enabled": false,
"format": null,
"distance": 30,
"align": "center",
"inside": null,
"allowOverlap": false,
"style": {
"fontSize": "11px"
}
},
"showInLegend": null,
"turboThreshold": 0,
"stacking": "",
"groupPadding": 0.2,
"centerInCategory": false,
"findNearestPointBy": "x"
}
},
"navigator": {
"enabled": false
},
"scrollbar": {
"enabled": false
},
"rangeSelector": {
"enabled": false,
"inputEnabled": false
},
"legend": {
"enabled": null,
"maxHeight": null,
"align": "center",
"verticalAlign": "bottom",
"layout": "horizontal",
"width": null,
"margin": 12,
"reversed": false
},
"series": [
{
"name": "c5ad.24xlarge by Amazon Web Services",
"color": "#f7981d",
"data": [
{
"x": 1012.4709993293962,
"y": 36516.407530325174
},
{
"x": 1019.4793192441382,
"y": 37616.54484088169
},
{
"x": 1013.982664814416,
"y": 37038.676955078074
},
{
"x": 1010.6767416410684,
"y": 37147.70971344544
},
{
"x": 1012.3389420577203,
"y": 36890.83008790482
},
{
"x": 1016.1644689259589,
"y": 37644.83142811397
},
{
"x": 1013.8711016752186,
"y": 36538.710449444545
},
{
"x": 1012.7181100717524,
"y": 36435.12182797871
},
{
"x": 1011.9722296768828,
"y": 36104.97827280802
},
{
"x": 1009.4406194605797,
"y": 36505.90450029382
},
{
"x": 1017.0927949426605,
"y": 36994.9563545041
},
{
"x": 1012.6503315052441,
"y": 36247.3632866407
},
{
"x": 1013.2566896316955,
"y": 36765.81703720258
},
{
"x": 1012.7799389551311,
"y": 36198.01729071025
},
{
"x": 1016.4806693632875,
"y": 37184.72419368354
},
{
"x": 1012.5137104898849,
"y": 36105.65298238375
},
{
"x": 1016.4005037486822,
"y": 37764.93947576689
},
{
"x": 1015.9714543298714,
"y": 36205.3034037013
},
{
"x": 1015.9376528728042,
"y": 38213.724696757155
},
{
"x": 1014.1453217877211,
"y": 36686.96320771281
}
]
}
],
"drilldown": {},
"tooltip": {
"enabled": true,
"useHTML": false,
"format": null,
"headerFormat": "",
"pointFormat": "<span style=\"color:{series.color}\">Single</span>: <b>{point.x:.0f}</b><br><span style=\"color:{series.color}\">Multi</span>: <b>{point.y:.0f}</b>",
"footerFormat": "",
"shared": false,
"outside": false,
"valueDecimals": null,
"split": false
},
"annotations": null
},
"hc_type": "chart",
"id": "171306437612742995249112553630931644097"
}
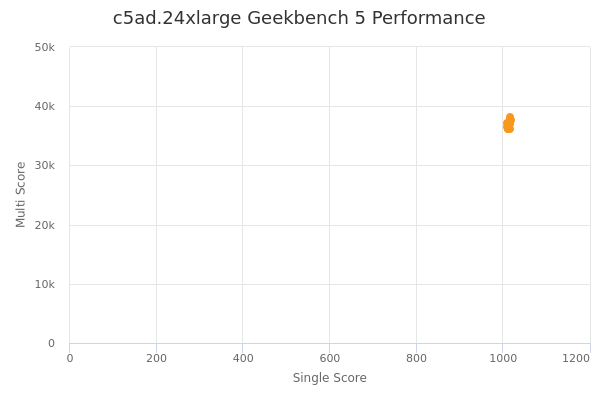
| Single | Multi | |
|---|---|---|
| Max | 1019 | 38214 |
| Average | 1014 | 36840 |
| Deviation | 2.37 | 592.40 |
| Min | 1009 | 36105 |
Sign up as Freemium to get more insight.